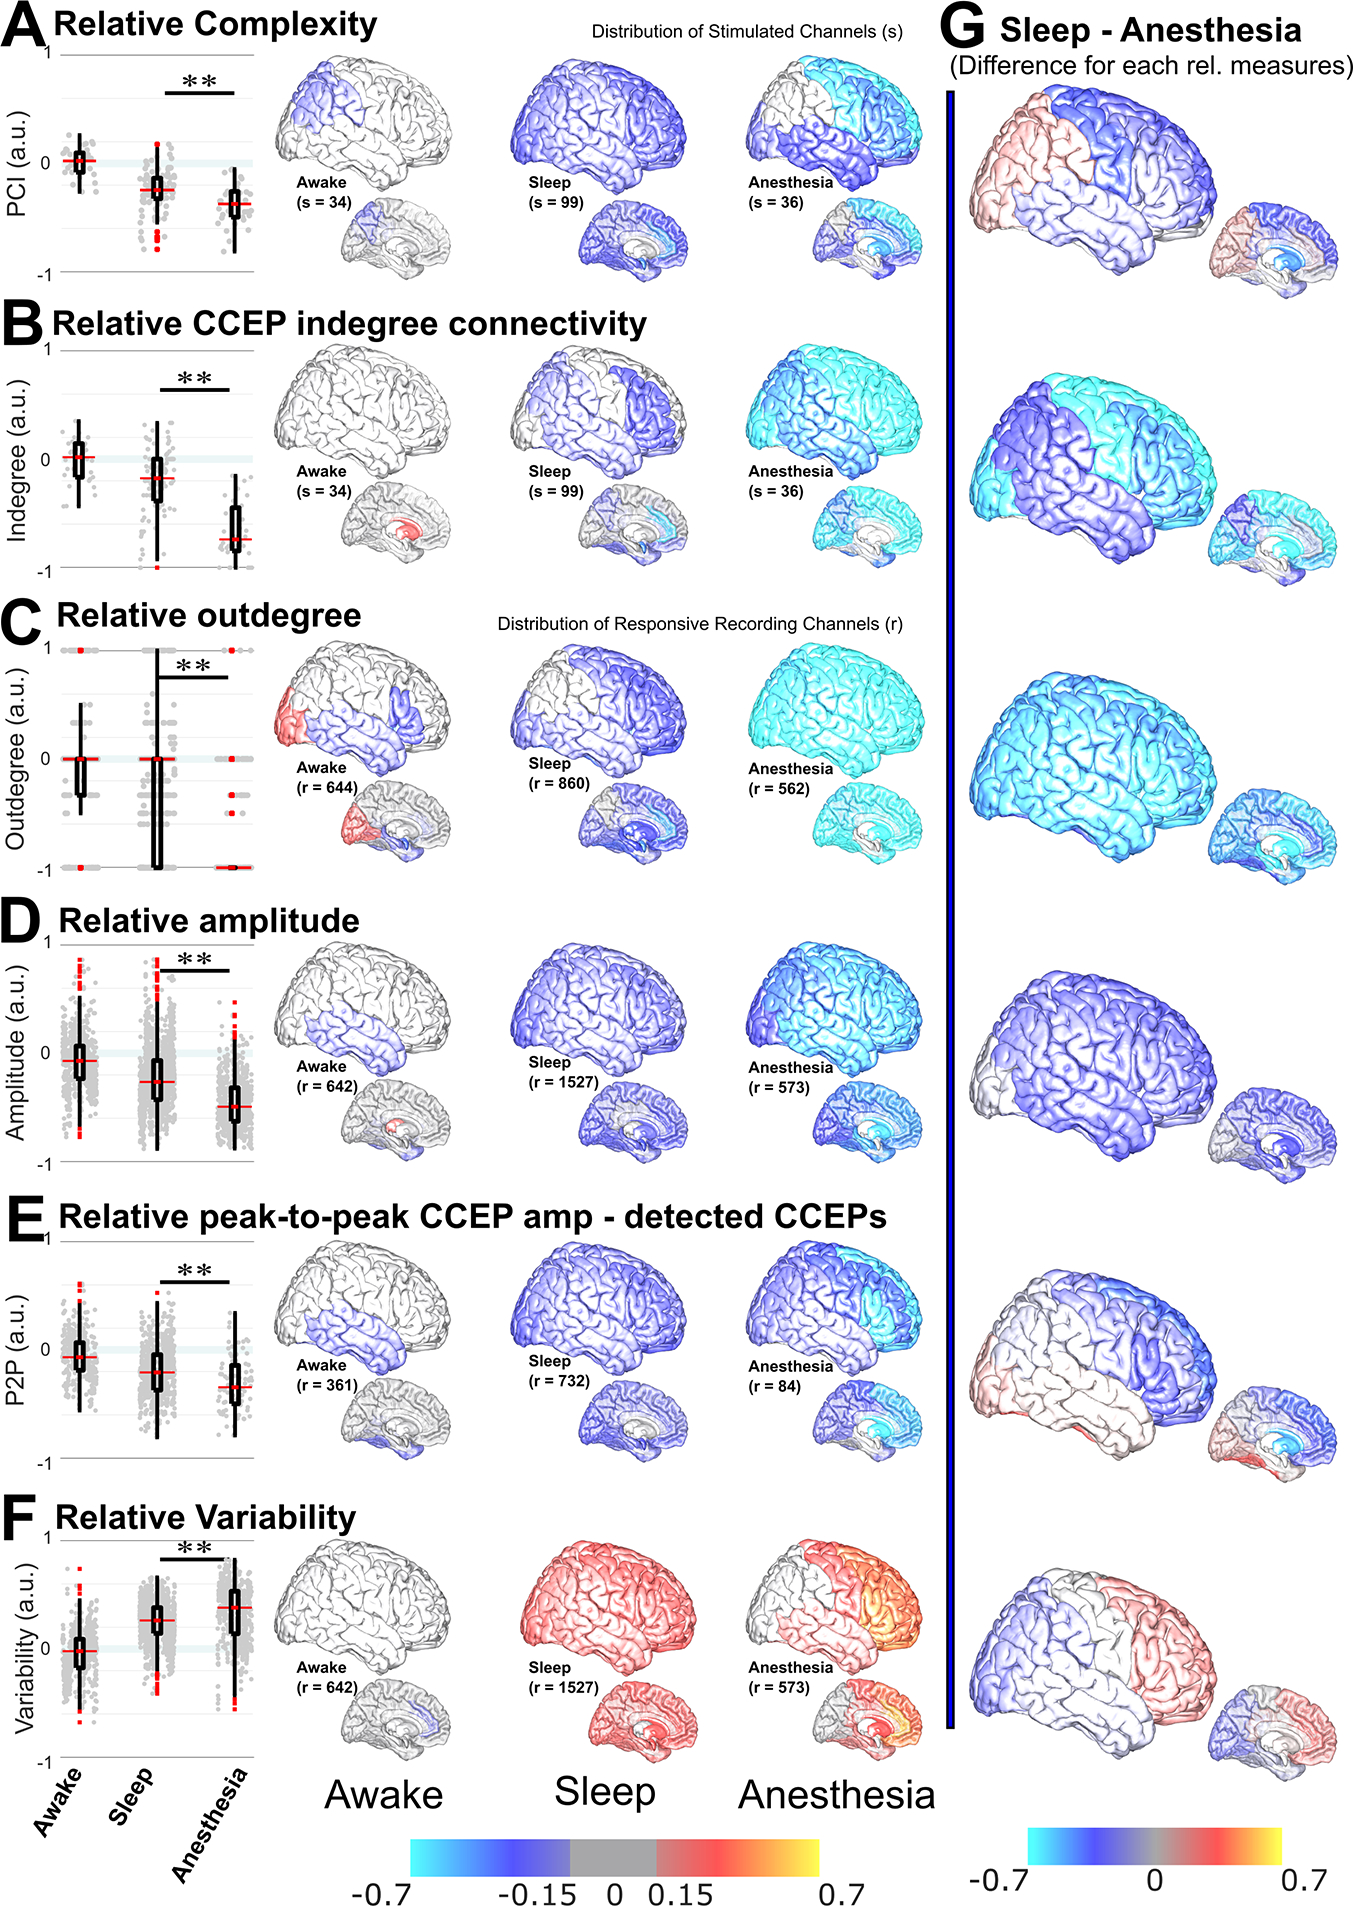
Figure 3. Relative measures comparing sleep vs. anesthesia.

Relative measures allowed comparison of arousable (sleep) vs. unarousable (anesthesia) unconscious states. Left: Positive (negative) values, bounded at +1 (−1), corresponded to an increase (decrease) in the relative measure. Awake corresponded to awake in the OR normalized by awake in the EMU, sleep was normalized by awake in the EMU, and anesthesia was normalized by awake in the OR. All relative measures were statistically different for sleep vs. anesthesia. Relative (A) complexity, (B) CCEP indegree connectivity, (C) outdegree, (D) amplitude across recording channels, and (E) peak-to-peak amplitude of the detected CCEPs (P2P), were significantly smaller for anesthesia than for sleep; F) Variability was significantly larger. Middle: Anatomical distribution of the averaged relative measure within a region pooling together participants and channels and plotted in the Collin27 atlas brain (left: awake; middle: sleep; right: anesthesia). Top row: lateral cortical regions (right and left hemispheres were merged); bottom row: subcortical and mesial regions. A) The anatomical distribution of relative complexity showed almost no changes during awake states, a uniform decrease across the brain during sleep, and a predominant decrease in frontal regions during anesthesia. B) The distribution of indegree showed almost no changes during awake states, while a decrease in parts of the brain was observed during sleep. During anesthesia, the relative CCEP connectivity decreased across the brain, with the most negative values in the frontal and occipital regions. C) For outdegree, frontal, central, occipital, and subcortical regions decreased during sleep, but the dispersion was large. During anesthesia, outdegree profoundly decreased across the brain, median = −1. D) Relative amplitude decreased across the brain during sleep, while during anesthesia it was more pronounced in anterior than posterior regions. E) Even when in some regions there was no difference in connectivity, the relative peak-to-peak amplitude of those CCEP responses homogenously decreased across the brain during sleep. Relative peak-to-peak CCEP amplitude during anesthesia decreased across the brain, with more negative values in prefrontal regions than anywhere else. F) The anatomical distribution of relative variability showed a uniform increase across the brain during sleep, and an increase in frontal and temporal regions, with larger values in prefrontal regions, during anesthesia. For awake in different environments, there were only a few differences, predominantly a decrease in the temporal lobe in the OR for outdegree and amplitude measures. G) Regional difference between sleep and anesthesia. A clear picture of the regional differences between sleep and anesthesia was obtained by subtracting the mean value per region for sleep minus anesthesia for each relative measure. There was an overall reduction of connectivity and amplitude for anesthesia. The prefrontal regions showed overall more pronounced changes, with decreased complexity, connectivity, and CCEP amplitude. Variability was larger in the prefrontal cortex for anesthesia minus sleep and smaller in posterior regions. Stimulation channels were considered for complexity and indegree and recording channels for the other measures. Gray dots in boxplots indicate individual stimulation (in A & B) or recording (in D-F) channels. In the distribution of relative measures, Red/orange/yellow indicated an increase while blue/cyan indicated a decrease. In the central figures, a threshold was set at |0.15|, with values −0.15 to +0.15 in gray. Mann–Whitney U-test was used for complexity, indegree, and outdegree. LMM & permutation tests were used for amplitude and variability. ** p<0.01. s: number of stimulated channels; r: number of recording channels. For relative values at individual stimulation channels, see Figure S4. See also Tables S4 & S5.
