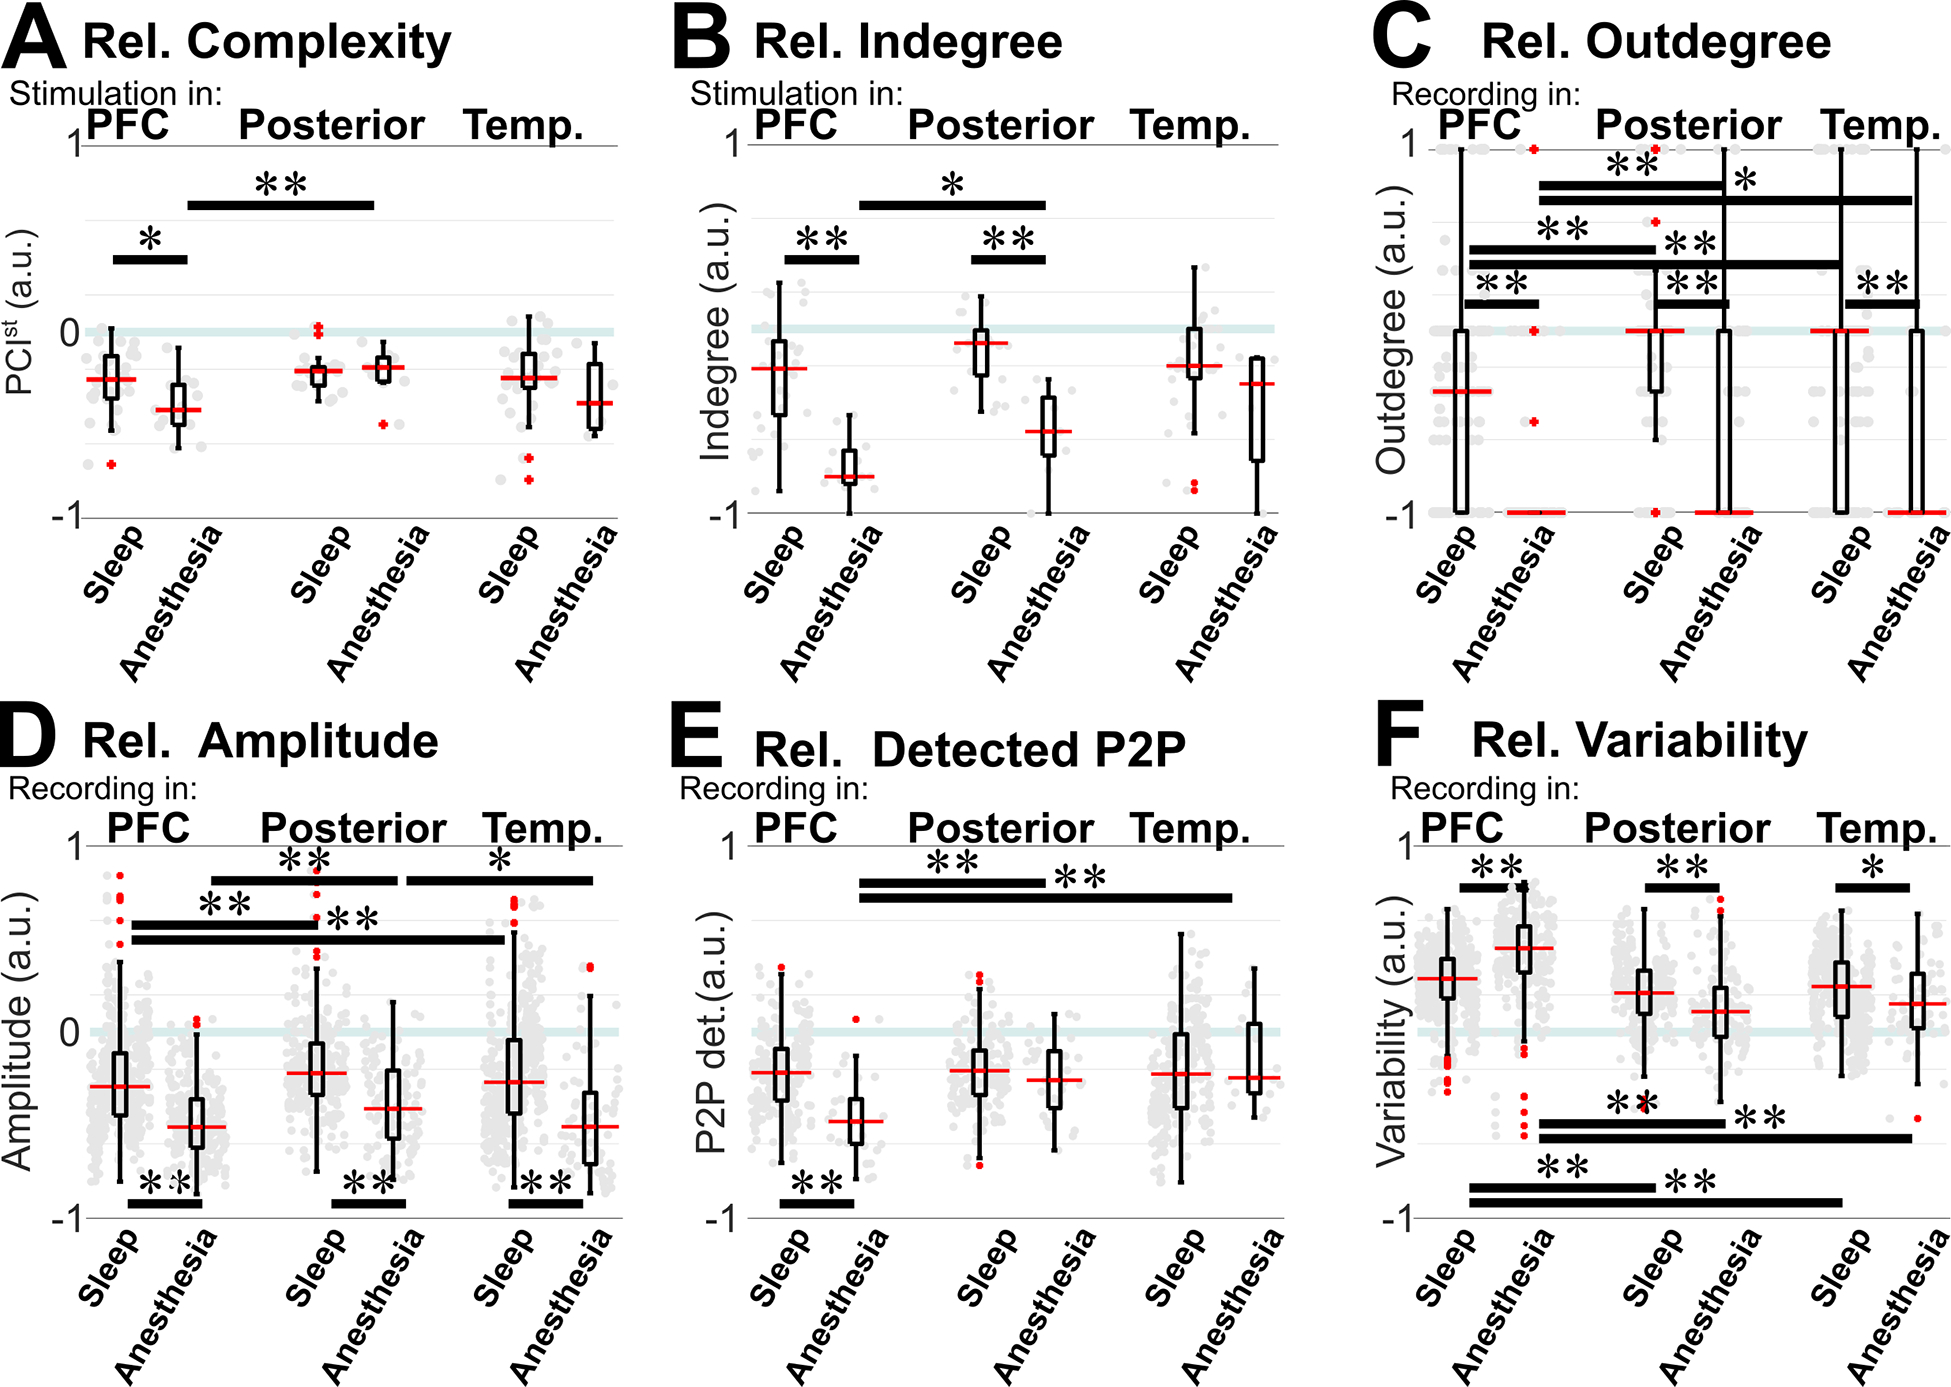
Figure 5. Comparison of relative measures during sleep vs. anesthesia and between regions.

A) Relative complexity was smaller for anesthesia than sleep with stimulation in the PFC, but similar with posterior stimulation. Within anesthesia, it was smaller for PFC than posterior stimulation; no significant difference was found between regions for sleep. B) Relative indegree was smaller for anesthesia than sleep with PFC or posterior stimulation. Within anesthesia, it was smaller for PFC than posterior stimulation; no significant difference was found between regions for sleep. C) Relative outdegree connectivity was smaller for anesthesia than for sleep regardless of recording region. Within anesthesia and within sleep, it was smaller for PFC than posterior or temporal channels. D) Relative amplitude was smaller for anesthesia than for sleep regardless of recording region. Within anesthesia and within sleep, it was smaller for PFC than posterior channels. E) Relative peak-to-peak amplitude of the detected CCEPs was smaller for anesthesia than sleep for PFC but not for posterior or temporal CCEP responses. Within anesthesia, it was smaller for PFC than posterior or temporal channels; no significant difference was found between regions for sleep. F) Relative variability was larger for anesthesia than sleep for PFC recordings. Interestingly, the opposite occurred for posterior or temporal recordings, where variability was smaller during anesthesia than during sleep. Within anesthesia and within sleep, variability was smaller for PFC than posterior or temporal channels. Gray dots: individual stimulation or recording channels. A-C: Mann–Whitney U-Mann test; D-F: permutation test. ** p<0.01; * 0.01≥p>0.05. PFC: prefrontal cortex; P2P: peak-to-peak CCEP amplitude; s: number of stimulated channels; r: number of recording channels with stimulation anywhere. See also Table S4–S6.
