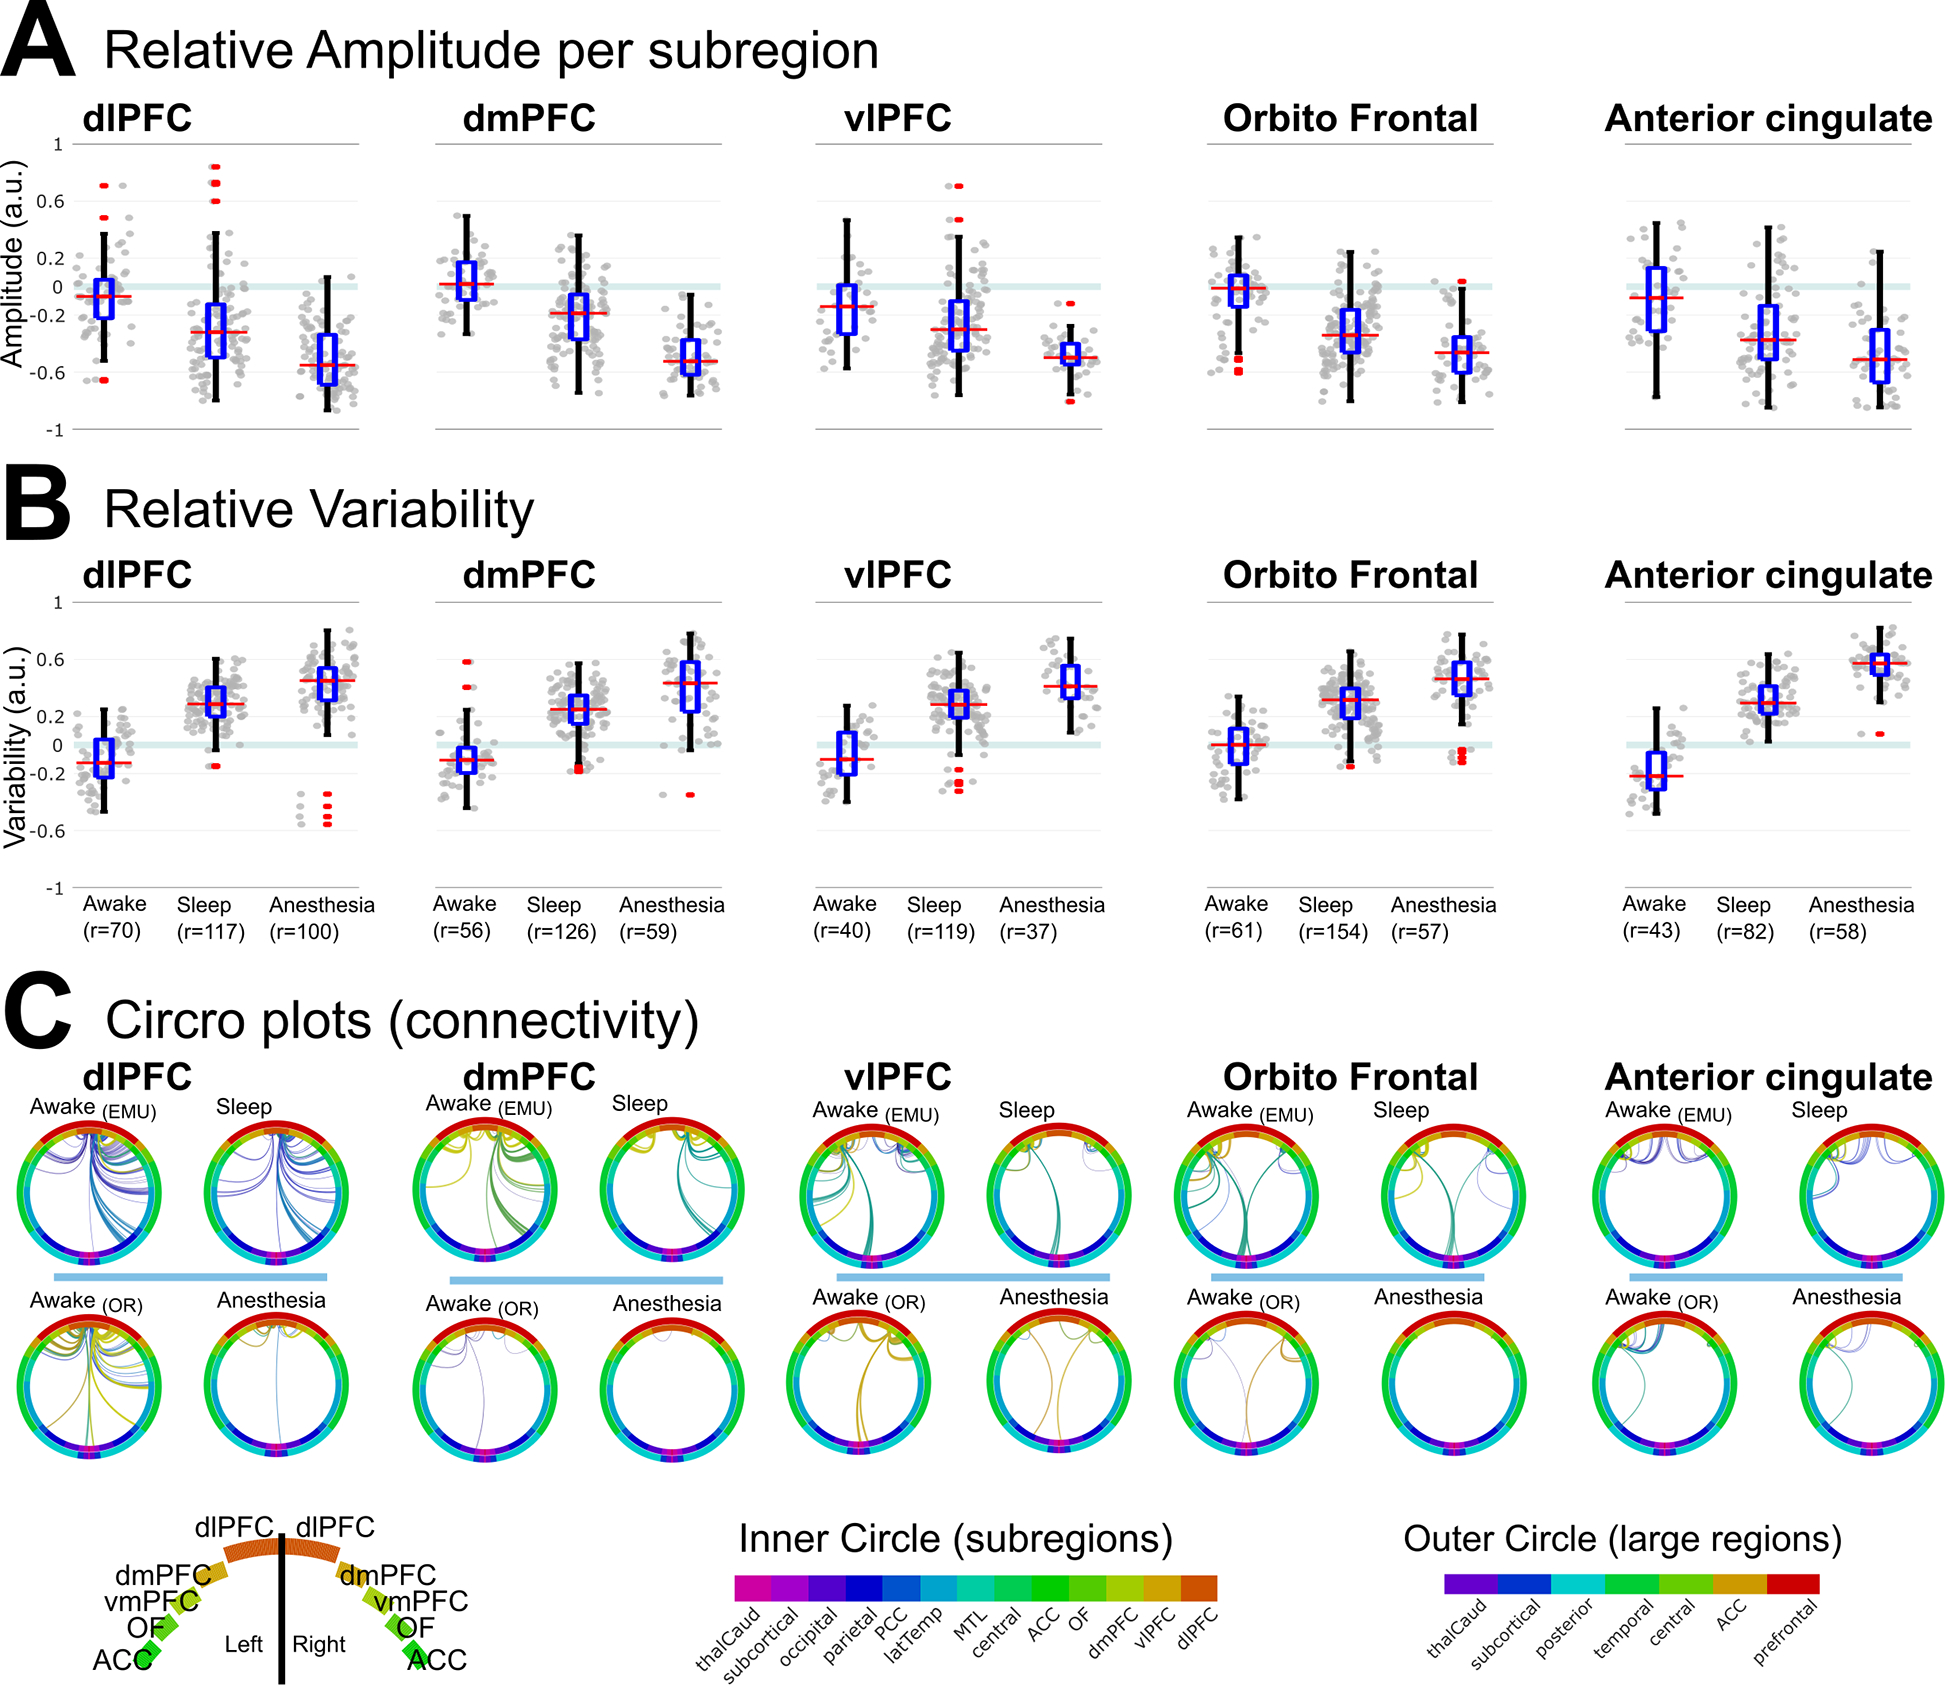
Figure 6. Relative measures for subregions of the prefrontal cortex showed consistent changes.

A) Relative amplitude was smaller for anesthesia than sleep for each of the subregions of the PFC and for the anterior cingulate. B) Relative Variability was larger for anesthesia than sleep for each of the subregions of the PFC and for the anterior cingulate. C) Circos plots of connections in each state. Top: during awake and sleep in the EMU, some connections were preserved. Bottom: during anesthesia, most connections disappeared. Edge colors: individual stimulation channels; inner ring: subregions; outer ring: lobes; PFC: prefrontal cortex; dlPFC: dorsolateral PFC; dmPFC: dorsomedial PFC; vlPFC: ventrolateral PFC. See also Table S5.
