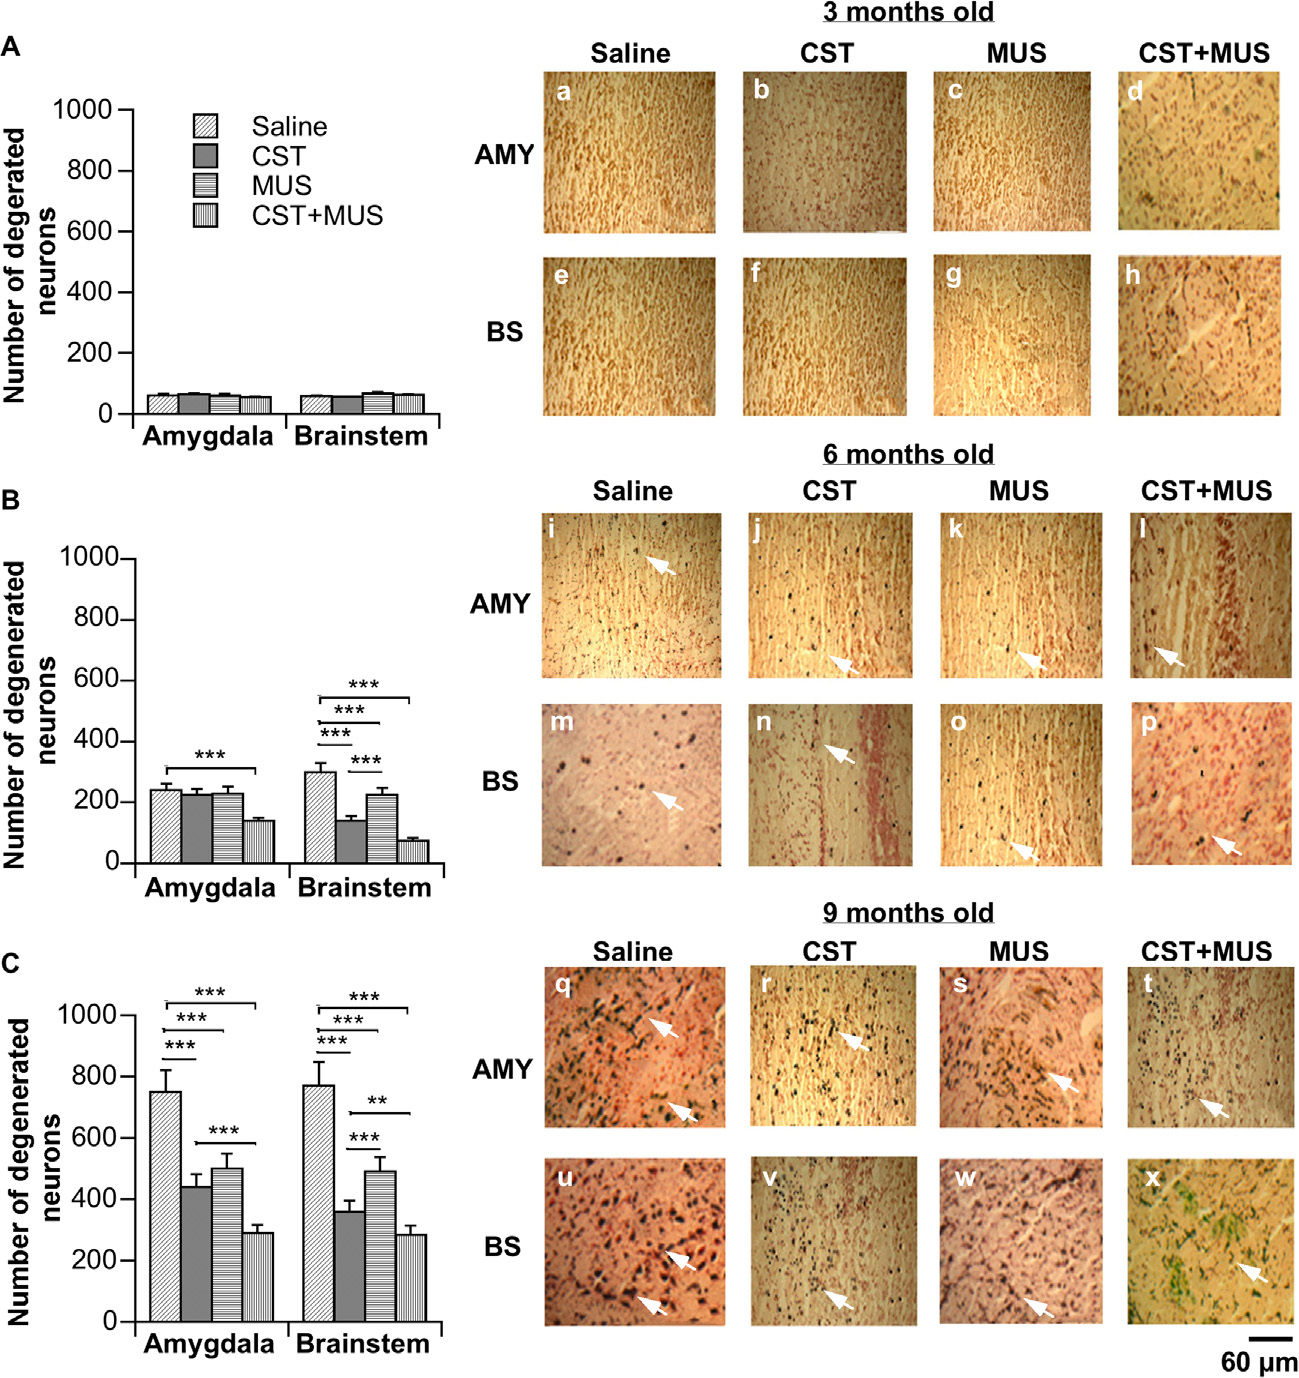
Fig. 4.

Neurodegeneration processes in AMY and BS of SHRs. Representative photograms of ACS (a–x) in which arrows point to dark neuronal perikarya that indicate damaged neurons showing the different levels of neurodegeneration/neuroprotection as reported for AMY and BS of SHRs that were 3 months old (Aa–h), SHRs that were 6 months old (Bi–p) and SHRs that were 9 months old (Cq–x) after brain injections of CST, MUS, CST + MUS in CeA with respect to controls that received only a saline solution. Scale bar = 60 μm. *p < 0.05, **p < 0.01 and ***p < 0.001.
