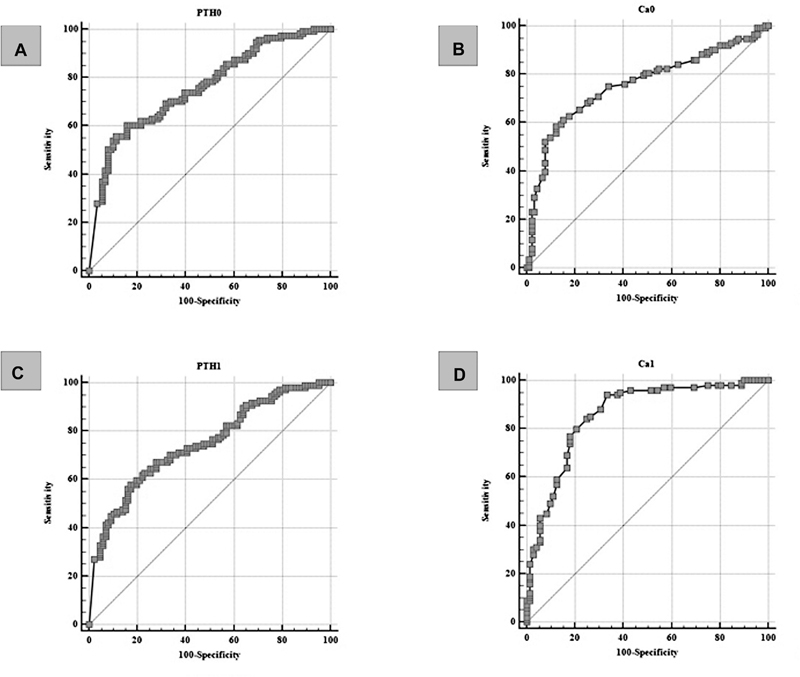
Fig. 4.

ROC curves of the correlation of laboratory parameters and the occurrence of laboratory verified hypocalcemia on the fifth postoperative day. ( A ) PTH concentration determined one hour after surgery predicts the occurrence of hypocalcemia on the fifth postoperative day with a sensitivity of 55.86% and a specificity of 88.64% at a cut-off value of ≤ 1.27 pmol/L (ROC analysis; AUC 0.760; 95% CI 0.695–0.818; p < 0.0001). ( B ) Serum calcium concentration determined one hour after surgery predicts the occurrence of hypocalcemia on the fifth postoperative day with a sensitivity of 58.41% and a specificity of 87.91% at the cut-off value of ≤ 1.99 mmol/L (ROC analysis; AUC 0.757; 95% CI 0.692- 0.814; p < 0.0001). ( C ) PTH concentration determined on the first postoperative day predicts the occurrence of hypocalcemia on the fifth postoperative day with a sensitivity of 57.94% and a specificity of 82.56% at a cut-off value of ≤ 1.55 pmol/L (ROC analysis; AUC 0.747; 95% CI 0.679–0.806; p < 0.0001). ( D ) Serum calcium concentration determined on the first postoperative day predicts the occurrence of hypocalcemia on the fifth postoperative day with a sensitivity of 94% and a specificity of 66.67% at a cut-off value of ≤ 2.1 mmol / L (ROC analysis; AUC 0.860; 95% CI 0.799–0.908; P-value <0.0001).
