
Fig. 3.
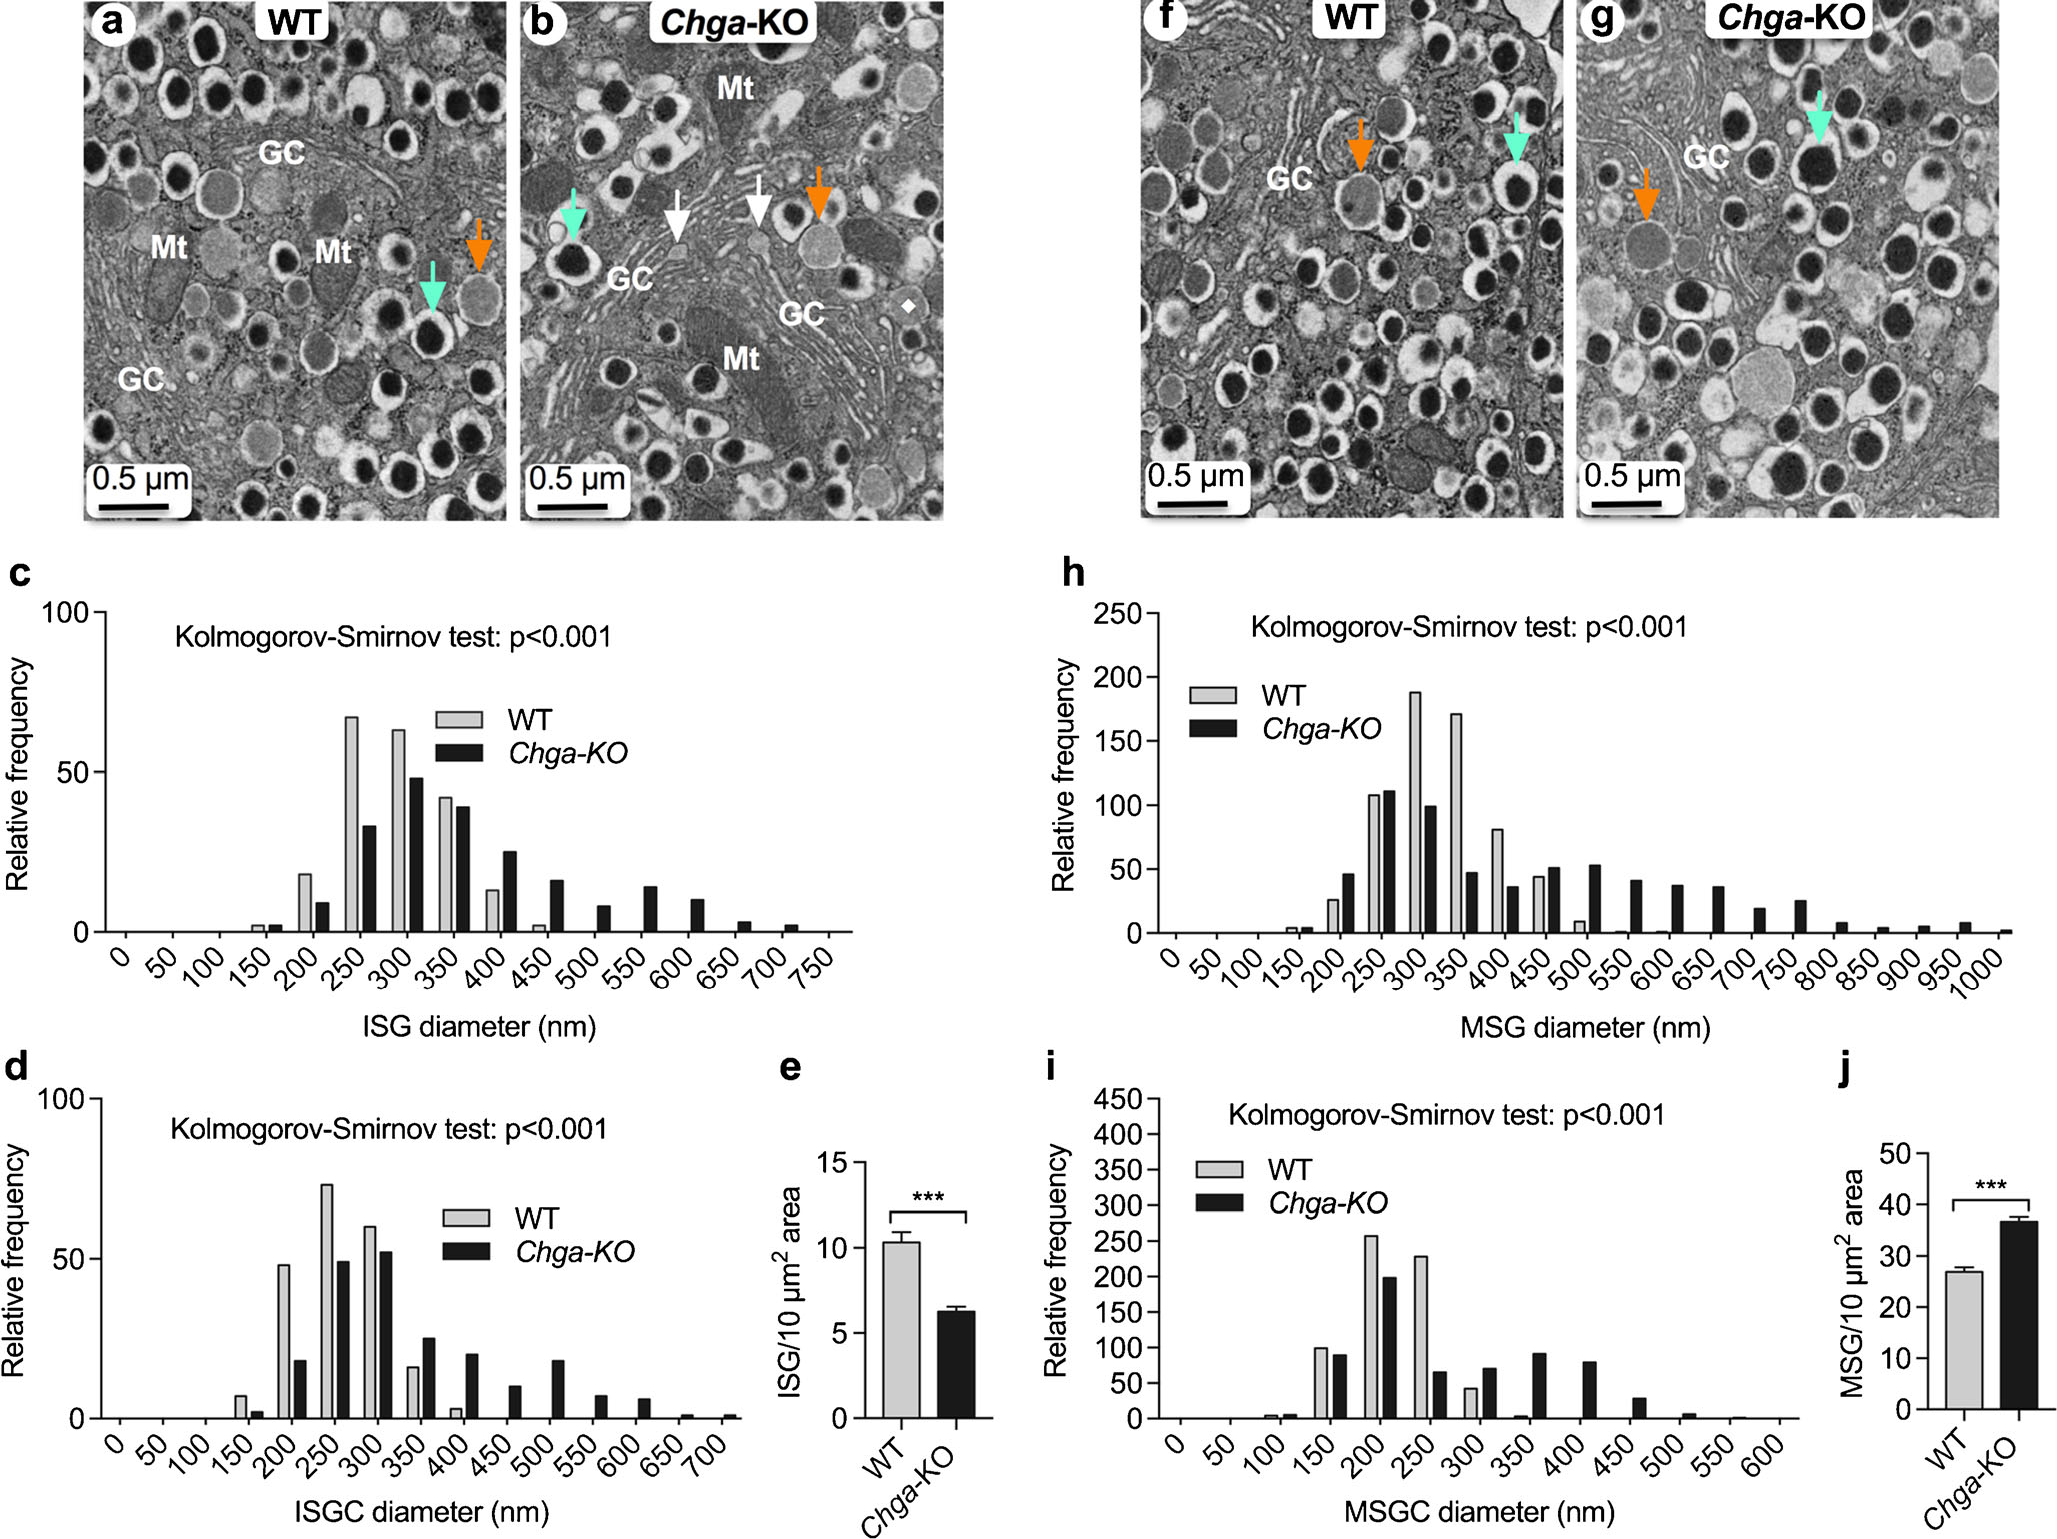
Analysis of α, β and δ-cell vesicular structure in pancreatic islets. TEM images of β-cells and morphometric analyses (620 vesicles from 4 mice each of the WT and Chga-KO mice) of ISG and MSG. a, b TEM images of a β-cell: a WT islets; b Chga-KO islets. Orange arrow points to an ISG and green arrow points to a MSG. White arrows indicate the formation of ISGs at the tip of a Golgi stack. Morphometric analyses of ISG (250 vesicles from 4 mice each of the WT and Chga-KO mice). c, d Distribution of ISG diameter (c) and ISGC diameter (d) in WT and Chga-KO islets. e Abundance of ISGs in WT and Chga-KO islets. f, g TEM images of a β-cell: f WT island and g Chga-KO island where orange arrow points to an ISG and green arrow points to a MSG. Morphometric analyses (650 vesicles from 4 mice each of the WT and Chga-KO mice). h, i Distribution of MSG diameters (h) and MSGC diameter (i) in WT and Chga-KO islets. j Abundance of MSGs in WT and Chga-KO islets. MSG mature secretory granule, MSGC dense core of MSG, GC Golgi complex, ISG immature secretory granule, ISGC light core of ISG, Mt mitochondria. ***P < 0.001