
Fig. 6.
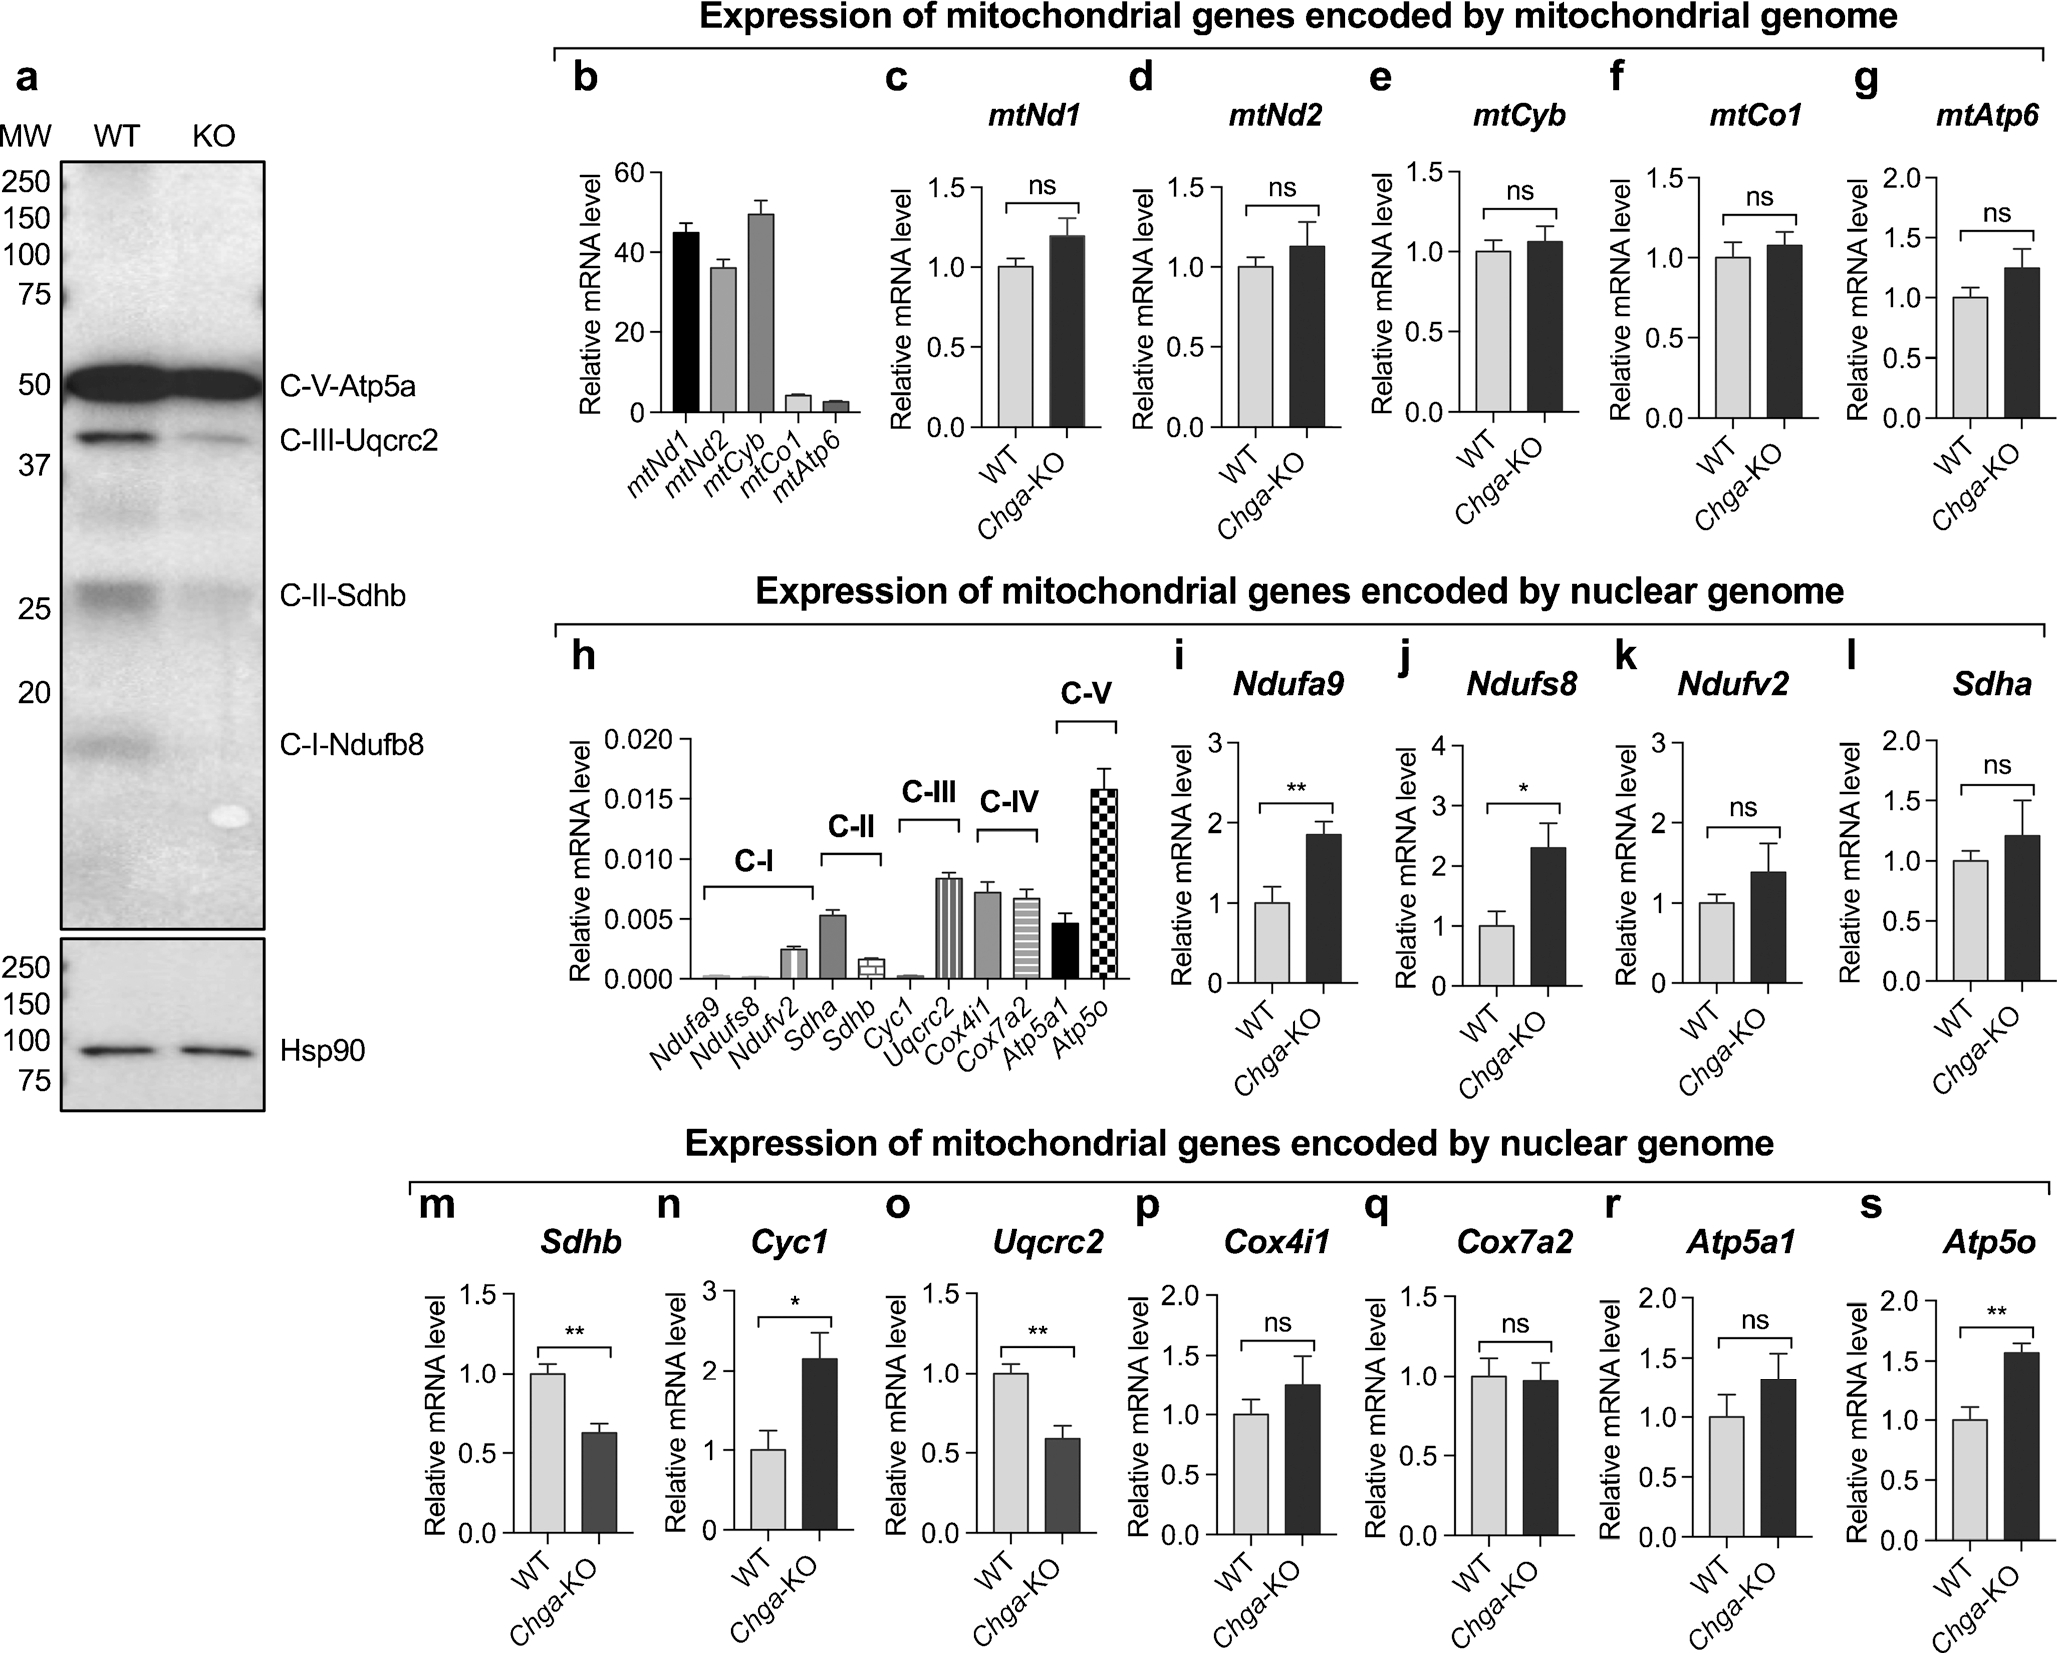
CgA modulates expression of genes regulating mitochondrial function. a Western blot showing expression of mitochondrial complex proteins. qRT-PCR data showing expression of genes encoded by mitochondrial and nuclear genomes. b–g Expression of genes encoded by mitochondrial genome: b basal mRNA levels of mitochondrial genes; c mtNd1 mRNA levels in WT and Chga-KO islets; d mtNd2 mRNA levels in WT and Chga-KO islets; e mtCyb mRNA levels in WT and Chga-KO islets; f mtCo1 mRNA levels in WT and Chga-KO islets; g mtAtp6 mRNA levels in WT and Chga-KO islets. h–s Expression of genes encoded by nuclear genomes: h basal expression of nuclear encoded genes in WT islets; i Ndufa9 mRNA levels in WT and Chga-KO mice; j Ndufs8 mRNA levels in WT and Chga-KO mice; k Ndufv2 mRNA levels in WT and Chga-KO mice; l Sdha mRNA levels in WT and Chga-KO mice; m Sdhb mRNA levels in WT and Chga-KO mice; n Cyc1 mRNA levels in WT and Chga-KO islets; o Uqcrc2 mRNA levels in WT and Chga-KO islets; p Cox4i1 mRNA levels in WT and Chga-KO islets; q Cox7a2 mRNA levels in WT and Chga-KO islets; r Atp5a1 mRNA levels in WT and Chga-KO islets; s Atp5o mRNA levels in WT and Chga-KO islets. *P < 0.05; **P < 0.01