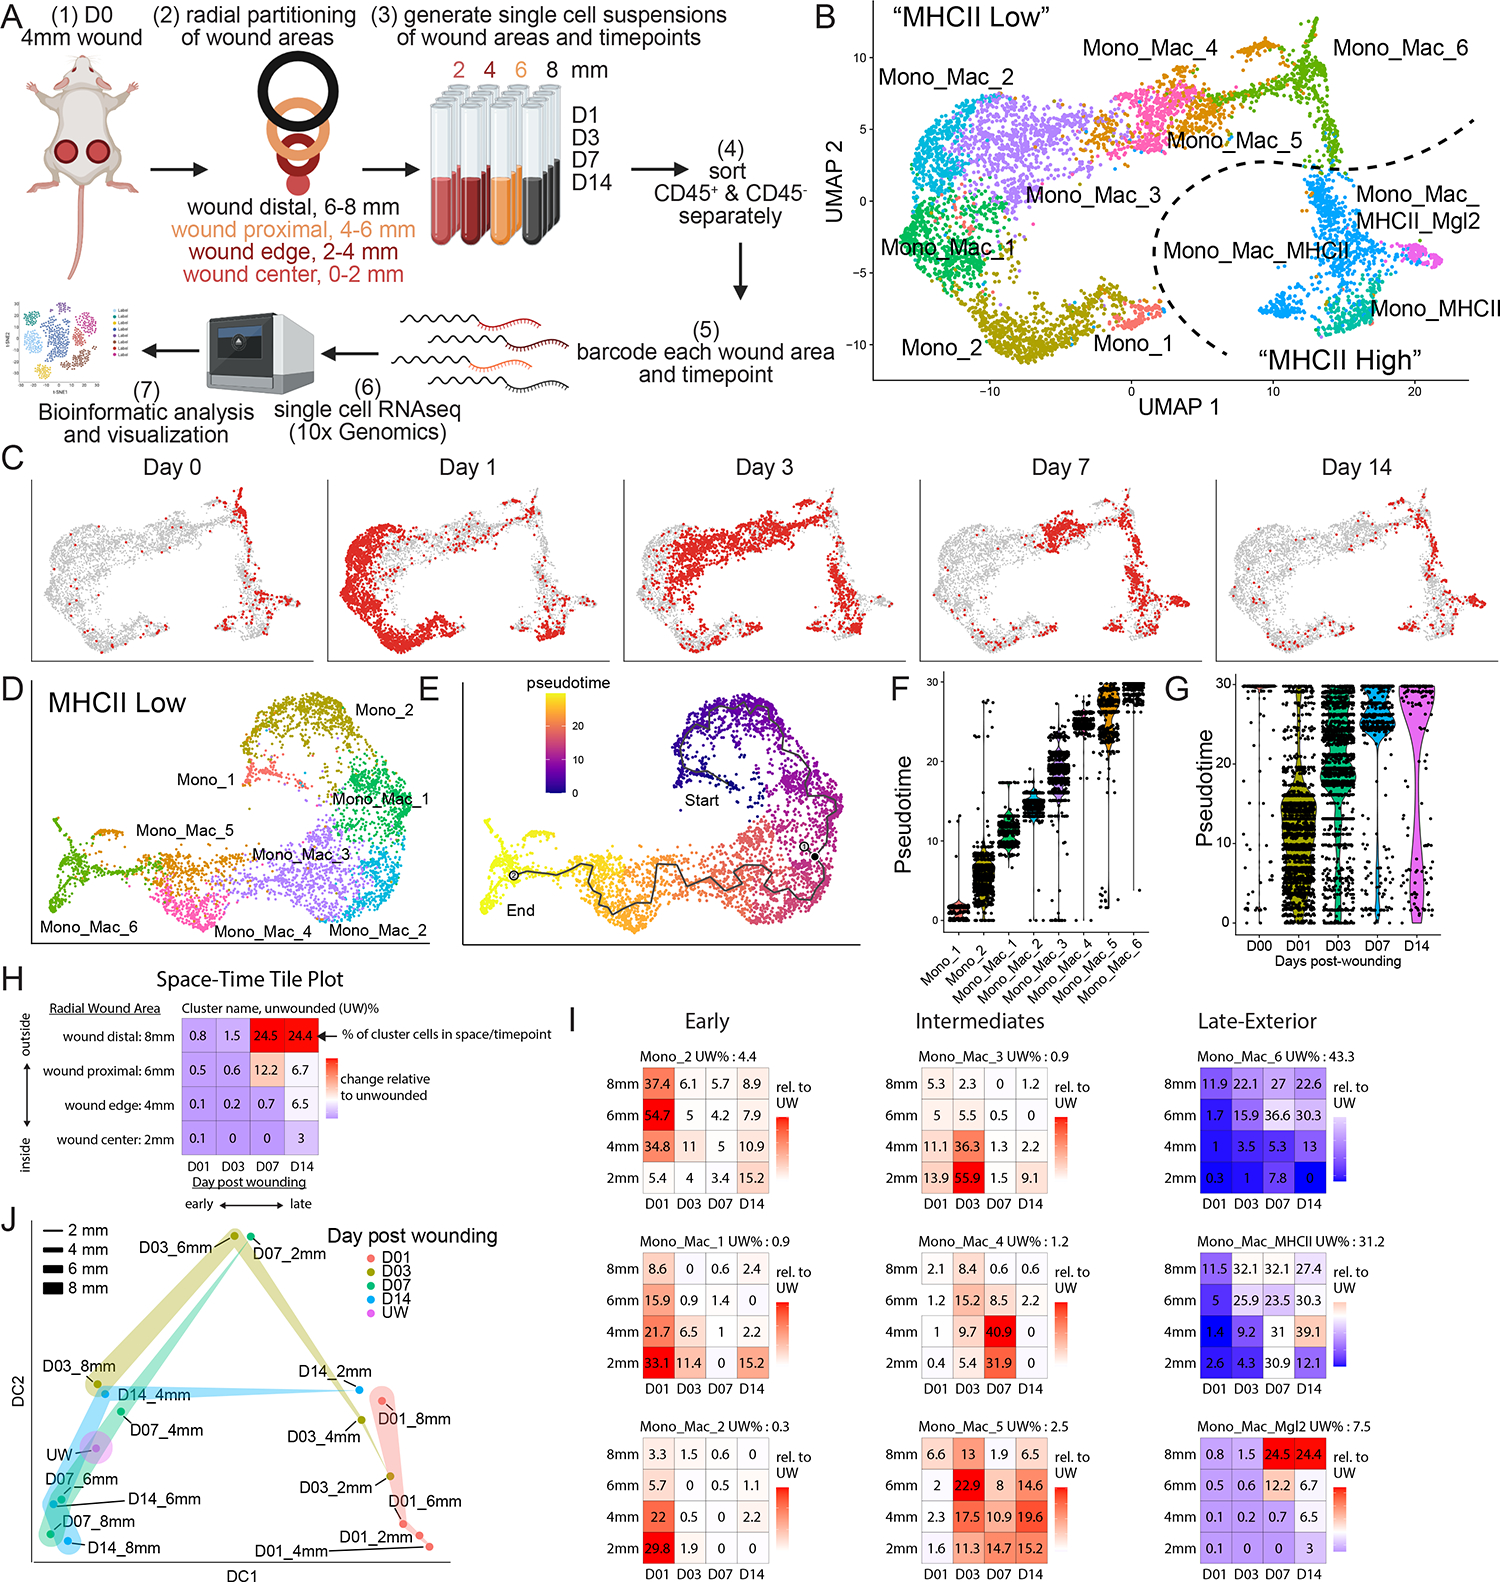
Figure 1. Transcriptional space-time analysis of single cells unveils unique patterns of monocyte/macrophage populations during skin repair.

(A) Experimental layout of transcriptional space-time analysis in wounded skin. Cells analyzed from each wound area and timepoint were pooled from 4 separate wounds. Image generated with Biorender.
(B) UMAP plot of monocyte/macrophage (Mono_Mac) subset from CD45+ object. Dotted line separates eight MHCIIlo and three MHCIIhi Mono_Mac clusters.
(C) UMAP projection of all Mono_Mac cells from (B) in gray and cells highlighted in red by timepoint of wound sampling.
(D) UMAP of MHCIIlo Mono_Mac subset with eight distinct clusters.
(E) Pseudotime trajectory using Monocle 3 on MHCIIlo Mono_Mac subset starting at cluster Mono_1, progressing through all cell clusters and ending at cluster Mono_Mac_6.
(F) Violin plot of MHCIIlo Mono_Mac subpopulations plotted according to their distribution in pseudotime.
(G) Violin plot of MHCIIlo Mono_Mac cells by day post-wounding and plotted according to their presence in pseudotime. D00 equals unwounded skin.
(H) Outline of Space-Time tile plot. The 4×4 grid depicts relative abundance of a cell cluster across radial wound area (y-axis) and time post wounding (x-axis). Each tile is one space-timepoint. Number in tile is the percentage of a subpopulation among all Mono_Mac cells at that specific space-timepoint. Background color indicates relative change compared to unwounded (UW) state: red indicates increase, blue indicates decrease, white indicates no change in subpopulation compared to UW. Exemplary data is depicted.
(I) Space-time tile plots representing Mono_Mac subpopulations.
(J) Phenotypic earth mover’s distance (PhEMD) diffusion map embedding of all space-timepoints. Each dot represents all CD45+ immune cells captured by scRNAseq within that space-timepoint. Dots are color-coded by day and width of band corresponds to area sampled. DC, diffusion coefficient.
See also S1.
