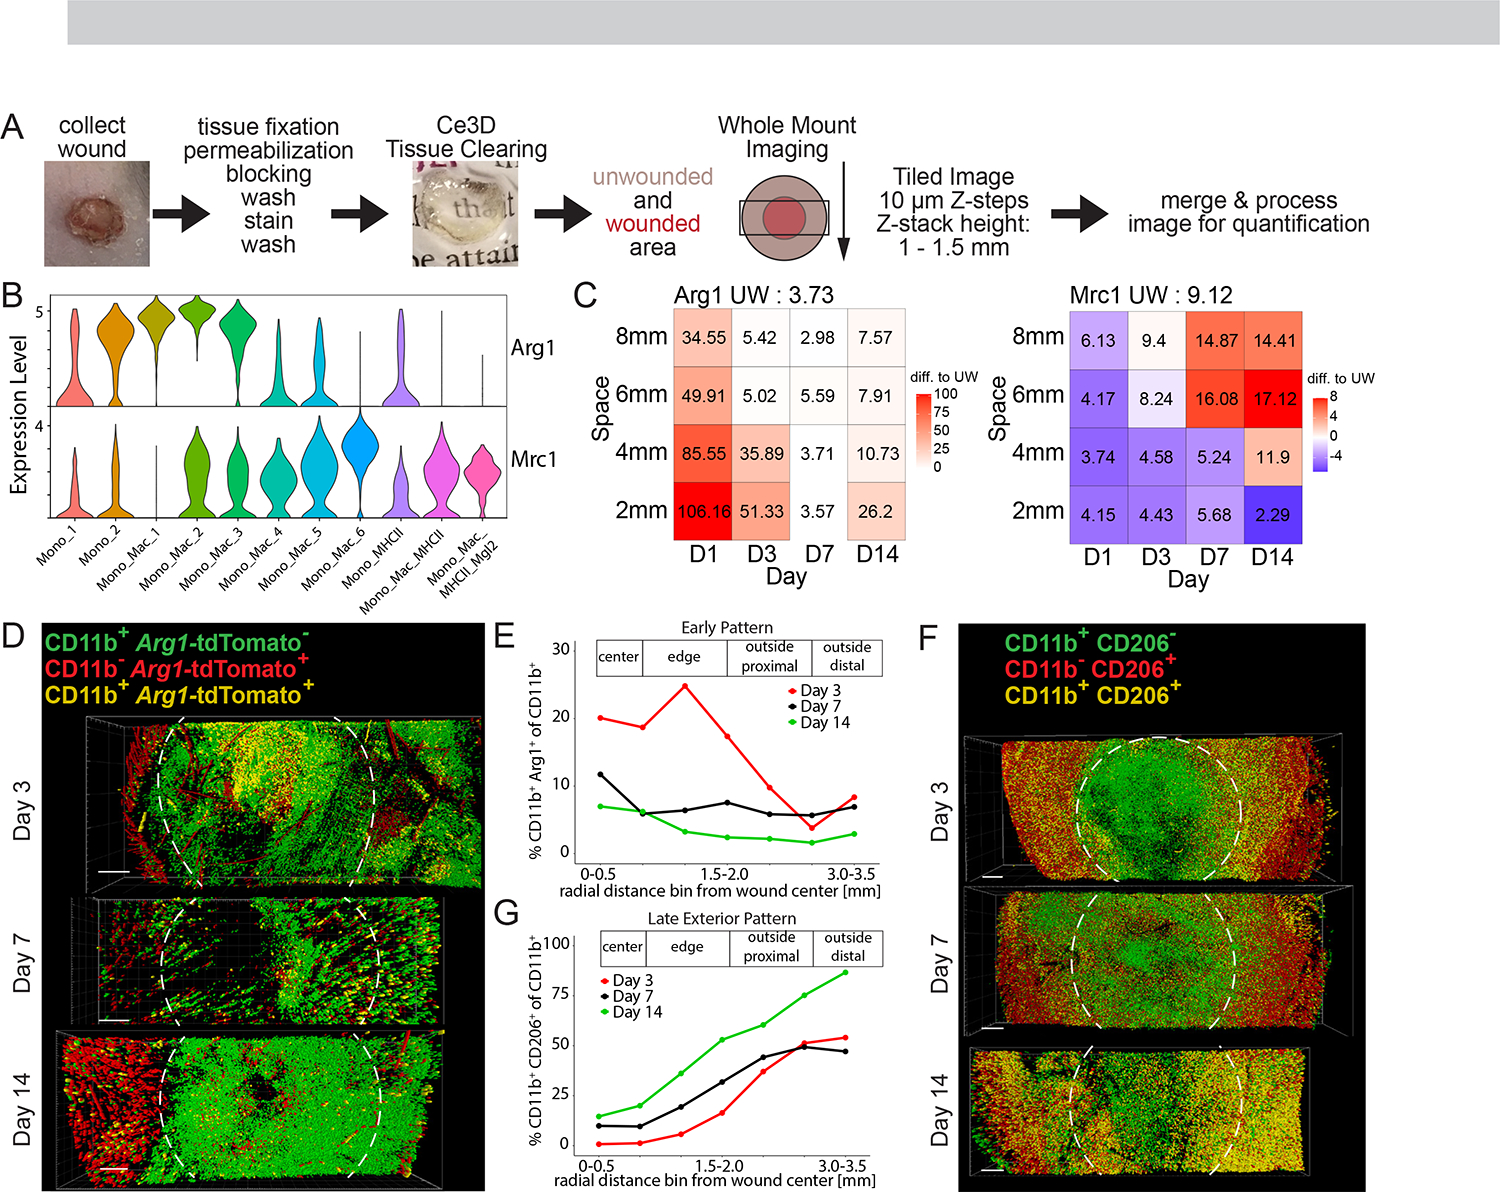
Figure 2. Large volume imaging visualizes spatial distribution of Mono_Mac subsets in whole wounds during skin repair.

(A) Workflow for large volume imaging. A rectangular cuboid covering the wound and surrounding unwounded skin tissue is acquired on a scanning confocal microscope. Acquired images are stitched together and processed for image analysis using Imaris.
(B) ViolinPlot of (left) Arg1 and (right) Mrc1 natural log-normalized mRNA expression level within all Mono_Mac subpopulations.
(C) Space-time tile plot of (left) Arg1 and (right) Mrc1 mRNA expression (normalized to depth) within all Mono_Mac cells. Tiles are color-coded relative to unwounded (UW) state. Red, high. Blue, low.
(D) Top-down view of processed image from Arg1-reporter mouse on days 3, 7, and 14 post-wounding. Colored dots indicate cell location of Arg1− CD11b+ Mono_Mac (green), Arg1+ CD11b− non-myeloid cells (red), and Arg1+ CD11b+ Mono_Mac_3 (yellow). Dotted line represents original 4 mm wound diameter. Bar, 500 μm. Representative of 2 independent experimental replicates is shown.
(E) Quantification of CD11b+ Arg1+ cells in (D) relative to distance from the center of the wound. Percentage of CD11b+ Arg1+ of all CD11b+ cells is plotted by day post wounding, representing an ‘Early Pattern’.
(F) Top-down view of processed image on days 3, 7, and 14 post-wounding. Colored dots indicate cell location of CD206− CD11b+ Mono_Macs (green), CD206+ CD11b− non-myeloid cells (red), and CD206+ CD11b+ Mono_Mac_6 (yellow). Dotted line represents original 4 mm wound diameter Bar, 500 μm. Representative of 2 independent experimental replicates is shown.
(G) Quantification of CD11b+ CD206+ cells in (F) relative to distance from the center of the wound. Percentage of CD11b+ CD206+ of all CD11b+ cells is plotted by day post wounding, representing a ‘Late Exterior Pattern’.
See also S2.
