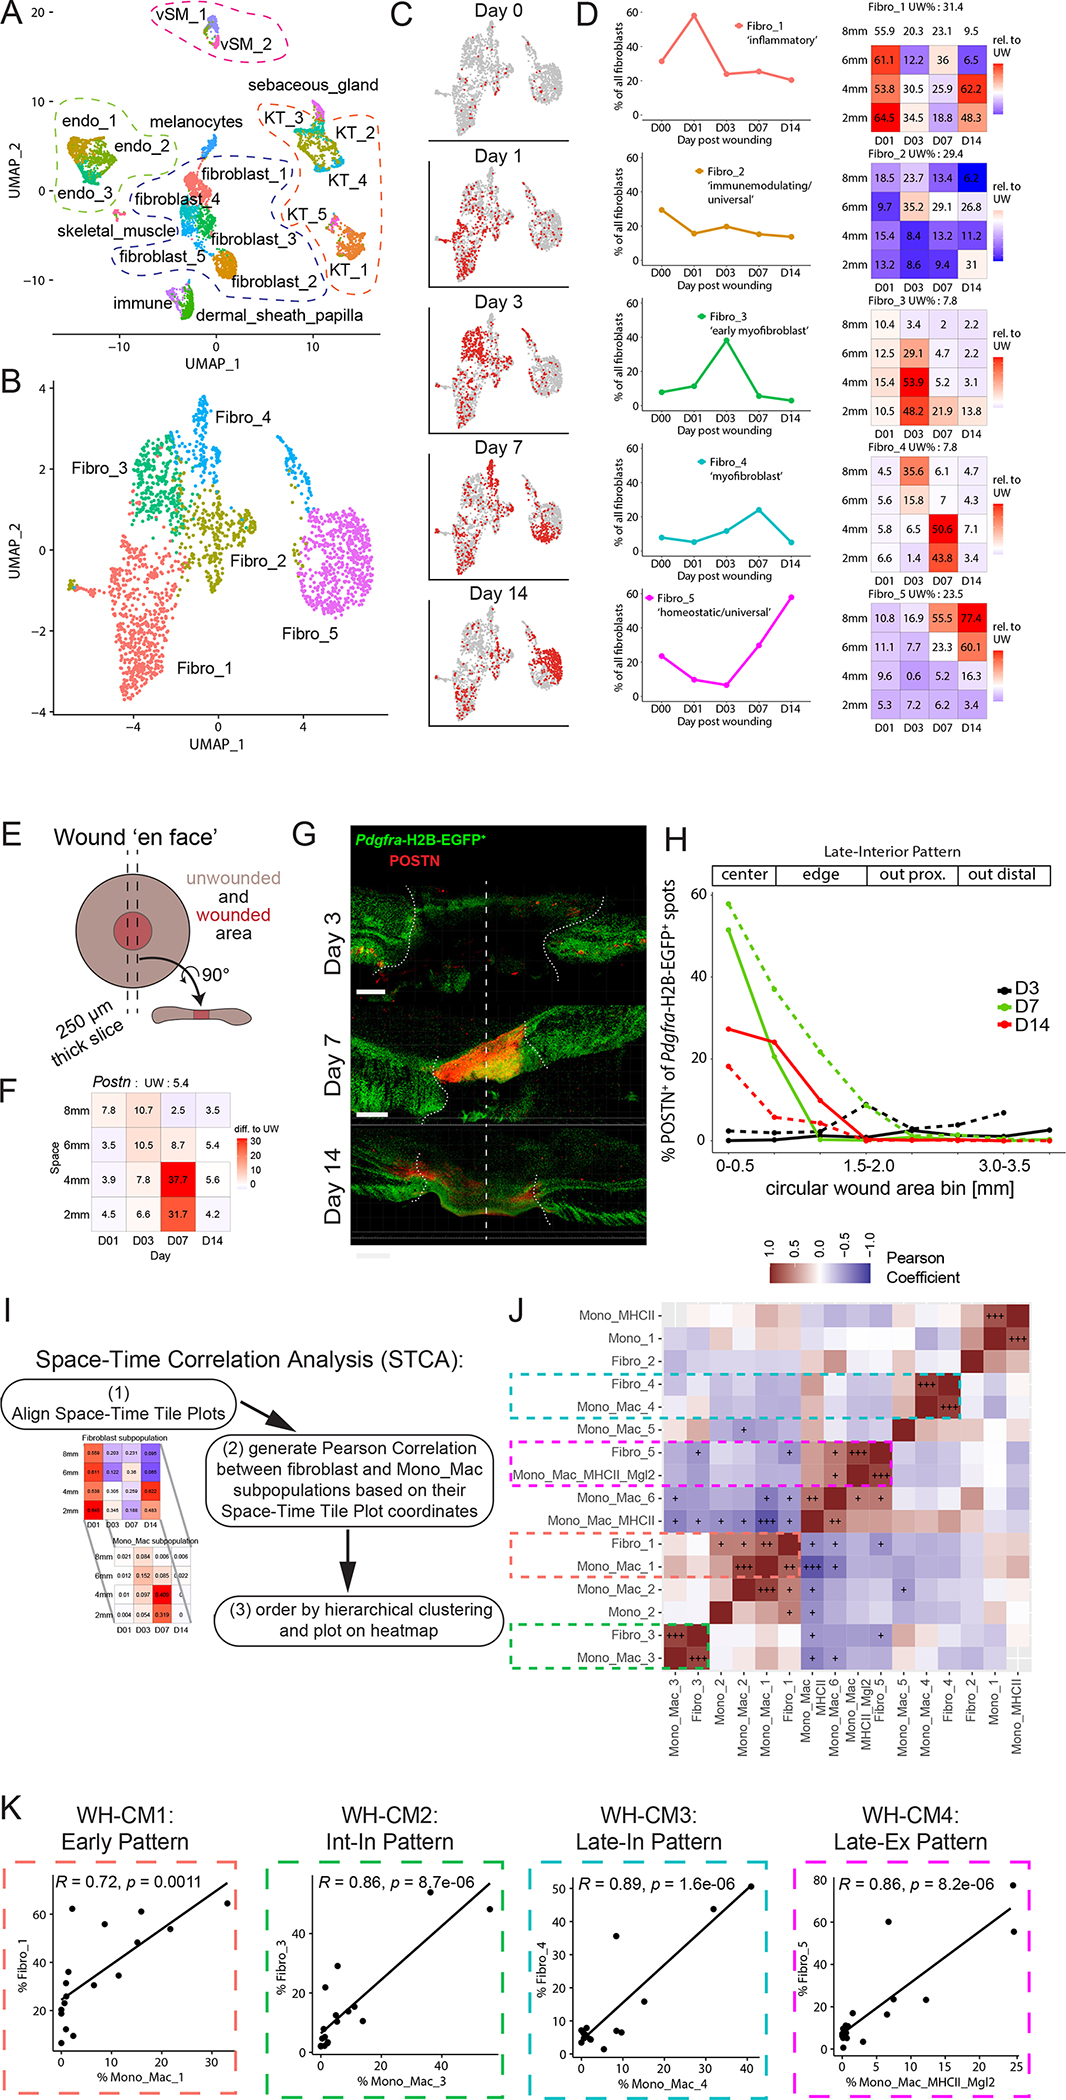
Figure 3. Unique space-time patterns of fibroblast subpopulations have matching Mono_Mac patterns.

(A) UMAP plot of CD45− non-immune cells during skin repair. Endo, endothelial cells. KT, keratinocytes. vSM, vascular smooth muscle.
(B) UMAP plot of the fibroblasts during skin repair.
(C) UMAP projection of all fibroblasts from (B) in gray and cells highlighted in red by timepoint of wound sampling.
(D) Left: Line plots of fibroblast subpopulations identified in the scRNAseq dataset during skin repair. Percentage of each subpopulation within all fibroblasts plotted by day post-wounding. Right: Space-time tile plot representing fibroblast subpopulations. Each tile is one space-timepoint. Number in tile is percentage of subpopulation among all fibroblasts at that specific space-timepoint. Color indicates relative change compared to unwounded (UW) state. Red indicates increase, blue indicates decrease in subpopulation compared to UW.
(E) Schematic depicting wound ‘en face’ imaging. A 250 μm thick cross-section of fixed wound tissue is collected, stained, cleared using Ce3D, and the whole volume is imaged by scanning confocal microscopy.
(F) Space-time tile plot of Postn mRNA expression (normalized to depth) within fibroblasts. Tiles color-coded relative to unwounded (UW) state. Red, high. Blue, low.
(G) 3D-views of dorsal skin wound cross-sections from Pdgfra-reporter mice collected at days 3, 7, and 14 post-wounding. Periostin (POSTN) protein staining shown in red. Dotted vertical line, day 0 wound center. Scale bar, 500 μm.
(H) Quantification of Pdgfra-H2B-EGFP+ spots proximal to POSTN+ staining as a percentage of all Pdgfra-H2B-EGFP+ spots in (G) relative to distance from the center of the wound. Percentage of POSTN-proximal Pdgfra-H2B-EGFP+ spots are plotted by day post wounding representing a ‘Late-Interior Pattern’. Two independent experiments shown overlaid with line dashes representing each replicate.
(I) Outline of Space-Time Correlation Analysis (STCA).
(J) Pearson correlation matrix output of STCA comparing fibroblast and Mono_Mac subpopulations. Correlation was calculated using Pearson correlation and significance adjusted for multiple comparisons using Bonferroni-Hochberg (BH) correction. +p-value<0.05, ++p-value<0.005, +++p-value<0.0005.
(K) Correlation xy-plots of select fibroblast-Mono_Mac subpopulation pairs displaying high Pearson correlation in occurrence in space-time during wound skin repair, as identified in (J). Each dot represents one space-timepoint, i.e. one tile from the space-time tile plot and the unwounded state. The percentage of each paired fibroblast and Mono_Mac cluster within the whole fibroblast or Mono_Mac population, respectively, is plotted for each space-timepoint. Pearson correlation test used to calculate correlation coefficient R and p-value. WH-CM, wound healing cell movement. Int-In, intermediate interior. Late-In, late interior. Late-Ex, late exterior.
See also S3.
