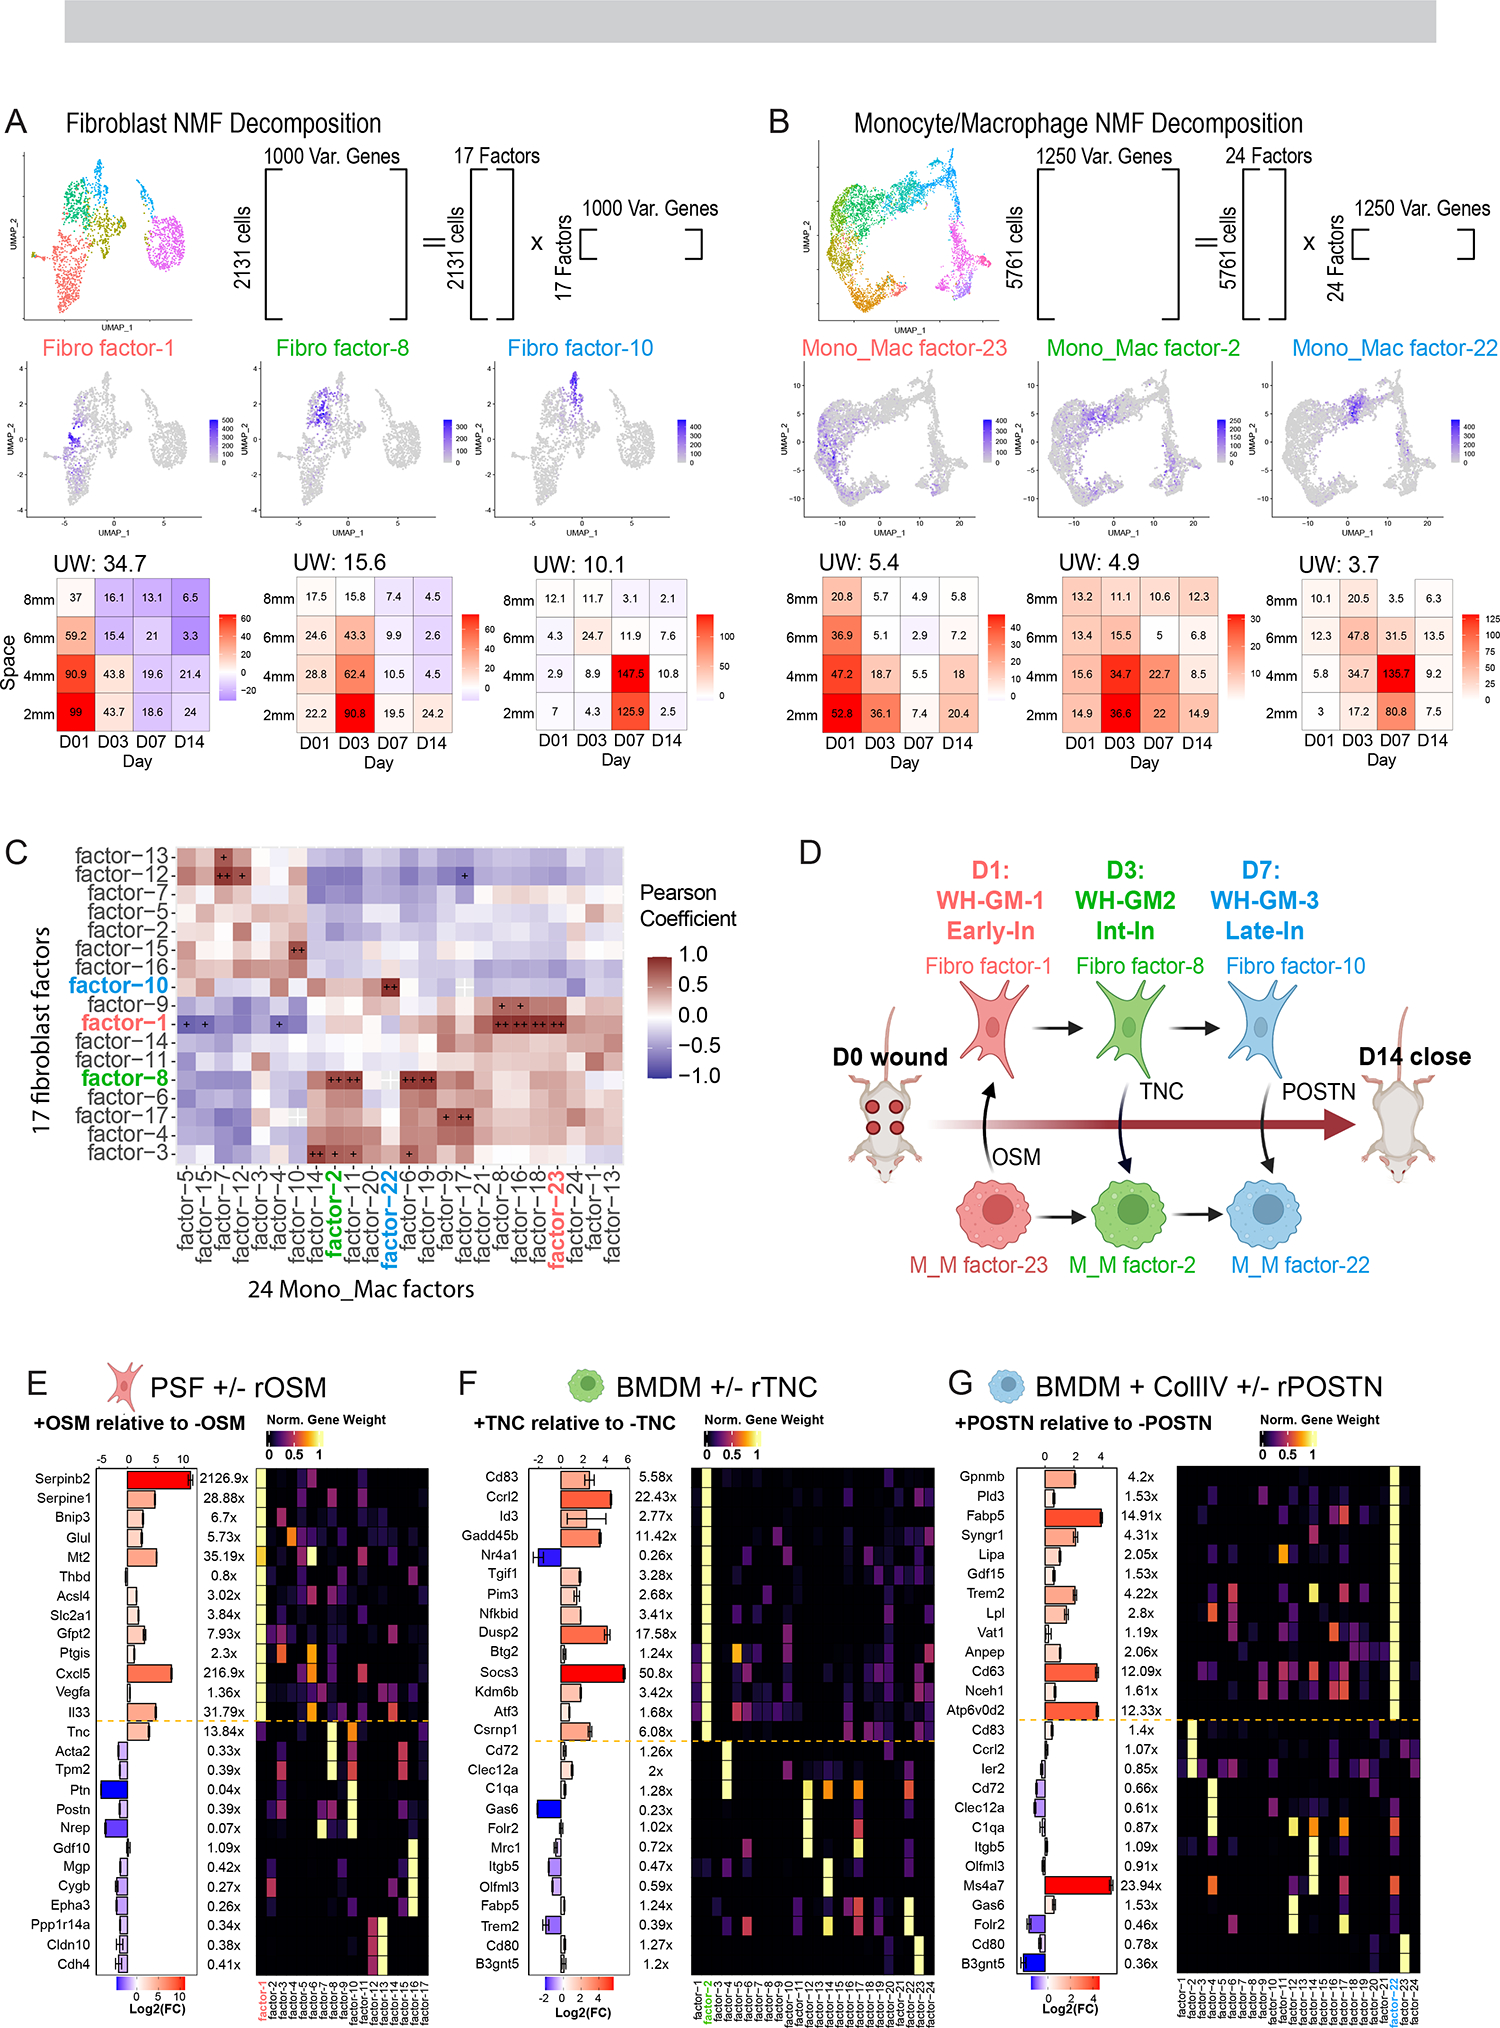
Figure 4. Gene program analysis identifies modules of gene expression across diverse cell types and predicts cell-cell interactions between macrophages and fibroblasts.

(A and B) Schematic showing strategy for NMF-based decomposition of the (A) fibroblast and (B) monocyte/macrophage populations. NMF decomposition of the fibroblast and Monocyte/Macrophage populations yielded 17/24 factors respectively. Shown are three example FeaturePlots for factor ‘expression’ and Tile Plots describing the average loading of the factor as a function of space-time, with colors indicating change of average expression relative to unwounded as in Fig. 1I
(C) Space-time correlation matrix for average factor expression profiles. Correlation was calculated using Pearson correlation and significance adjusted for multiple comparisons using BH Correction. + (alpha <0.05), ++ (alpha <0.005).
(D) Cartoon schematic of hypothetical fibroblast-macrophage crosstalk and progression over the timespan of wound healing. Three putative interactions that we investigate in vitro are labeled. WH-GM, wound healing gene movement. OSM, oncostatin M. TNC, tenascin-C. POSTN, periostin. Early-In, early interior. Int-In, intermediate interior. Late-In, late interior.
(E) RT-qPCR quantification of gene transcripts in PSF’s predicted from gene program analysis (see S4B) to contribute most to Fibroblast factor-1 as well as genes contributing to other factors as a negative control. Bar chart and color scale denote the Log2 fold-change of relative expression between the OSM treated and untreated PSF’s. Error bars denote standard error of the mean from technical triplicates. Data is representative of two independent experiments. Right heatmap shows the normalized gene weight contribution to all 17 identified fibroblast factors for the genes being probed.
(F) RT-qPCR quantification of gene transcripts in BMDM’s predicted from gene program analysis (see S4A) to contribute most to Mono_Mac factor-2 as well as genes contributing to other factors as a negative control. Bar chart and color scale denote the Log2 fold-change of relative expression between the TNC treated and untreated BMDM’s. Error bars denote standard error of the mean from technical triplicates. Data is representative of two independent experiments. Right heatmap shows the normalized gene weight contribution to all 17 identified Mono_Mac factors for the genes being probed.
(G) RT-qPCR quantification of gene transcripts in BMDM’s predicted from gene program analysis (see S4A) to contribute most to Mono_Mac factor-22 as well as genes contributing to other factors as a negative control. Bar chart and color scale denote the Log2 fold-change of relative expression between the POSTN treated and untreated BMDM’s. Error bars denote standard error of the mean from technical triplicates. Data is representative of two independent experiments. Right heatmap shows the normalized gene weight contribution to all 17 identified Mono_Mac factors for the genes being probed.
