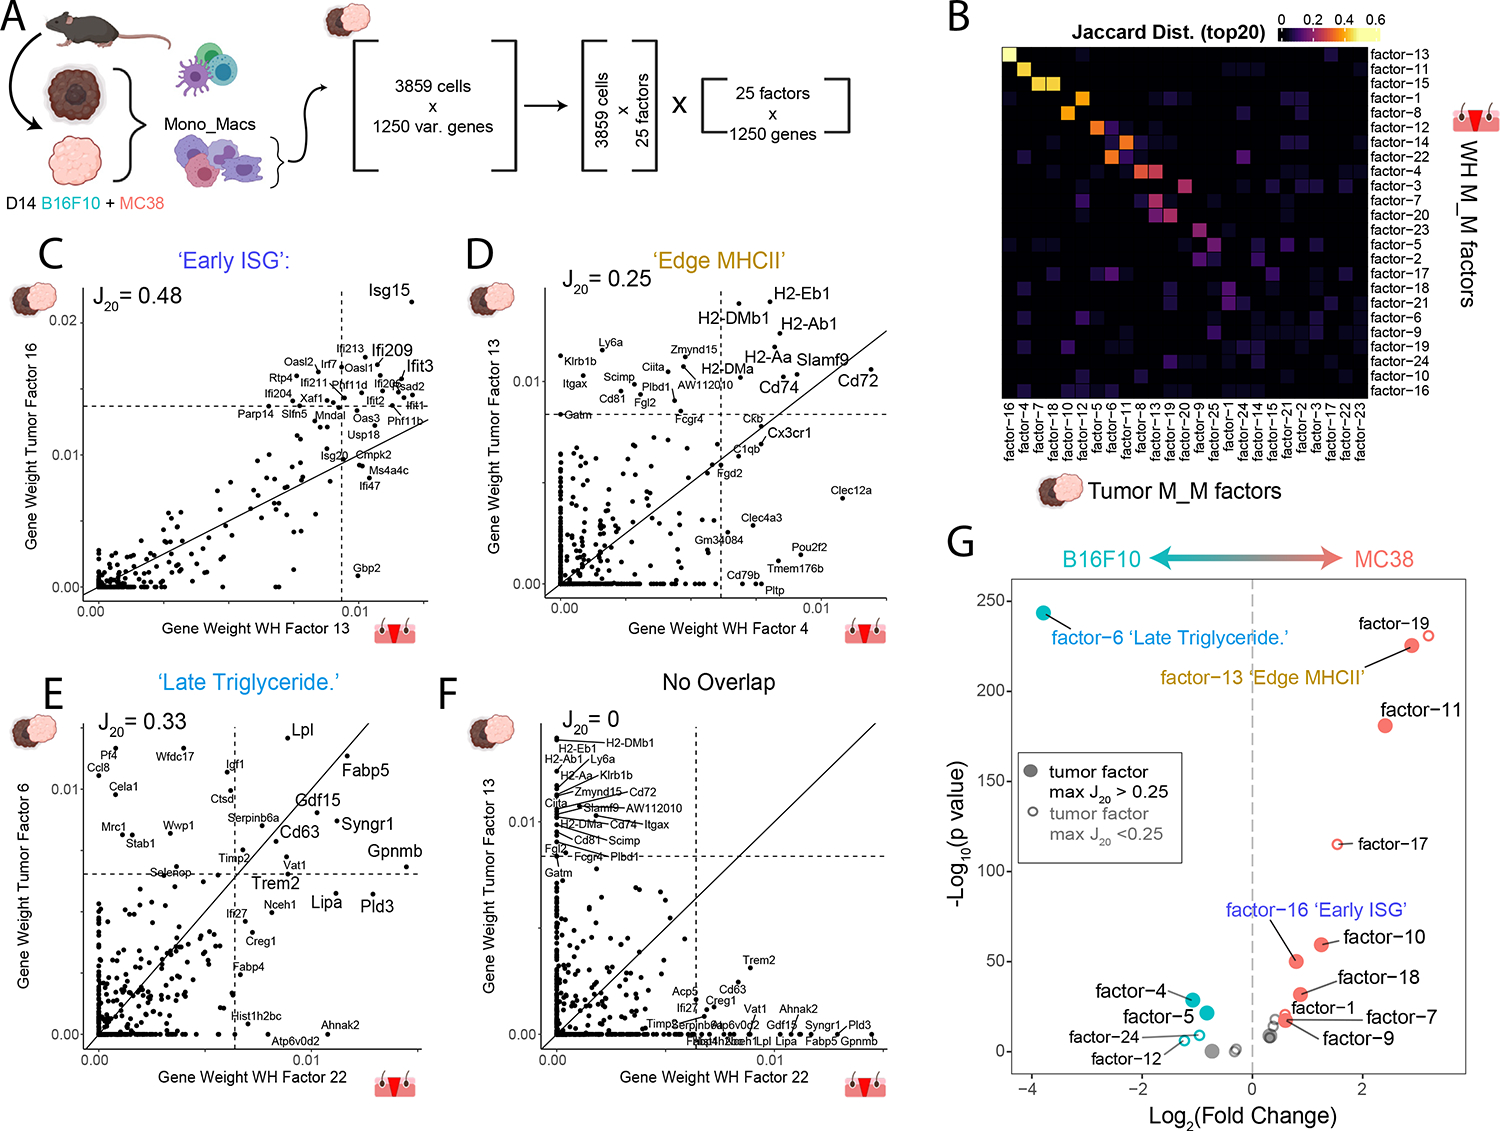
Figure 5. Identification of conserved gene programs in Mono_Mac between wound healing and mouse tumor models.

(A) Strategy for generation of a multi-tumor model Mono_Mac CD45+ scRNA-Seq dataset. Following integration, Mono_Mac populations were selected for NMF decomposition, starting with 3859 cells and the top 1250 variable genes expressed in at least 2% of cells. This resulted in 25 factors of interest based on the cophenetic metric (seen in Figure S5C)
(B) Heatmap showing the Jaccard20 distance (defined in STAR Methods) between all 25 M_M tumor and 24 M_M WH factors based on top contributing gene weights.
(C-F) Scatter plots for selected tumor/WH factor pairs for (C) Tumor factor-16 vs WH factor-13, (D) Tumor factor-13 vs WH factor-4, (E) Tumor factor-6 vs WH factor-22, and (F) Tumor factor-13 and WH factor-22 with the gene weight contributions plotted as calculated from the basis matrix in the NMF output (see Figure S4A for WH factors and S5B for tumor factors). Slope represents x=y line and dotted lines represent the weight for the 20th highest gene contribution in either factor. The Jaccard20 index is shown and thus reflects the frequency of points in quadrant I over quadrants I, II and IV. For pairings in C-E, top shared genes in the upper right quadrant were put through Enrichr to find overrepresented cellular processes with the top result by p-value listed. Full Enrichr output can be found in the extended data (Table S2).
(G) Volcano plot showing differential loading of factors between MC38 and B16F10 Mono_Mac. Datasets for the 25 identified factors. Y-axis denotes log10 of unadjusted p-value. Labelled points have adjusted p-value < 0.05 (Bonferroni correction) and absolute log2 fold-change greater than 0.5. Colored points have absolute log2 fold change greater than 0.5.
