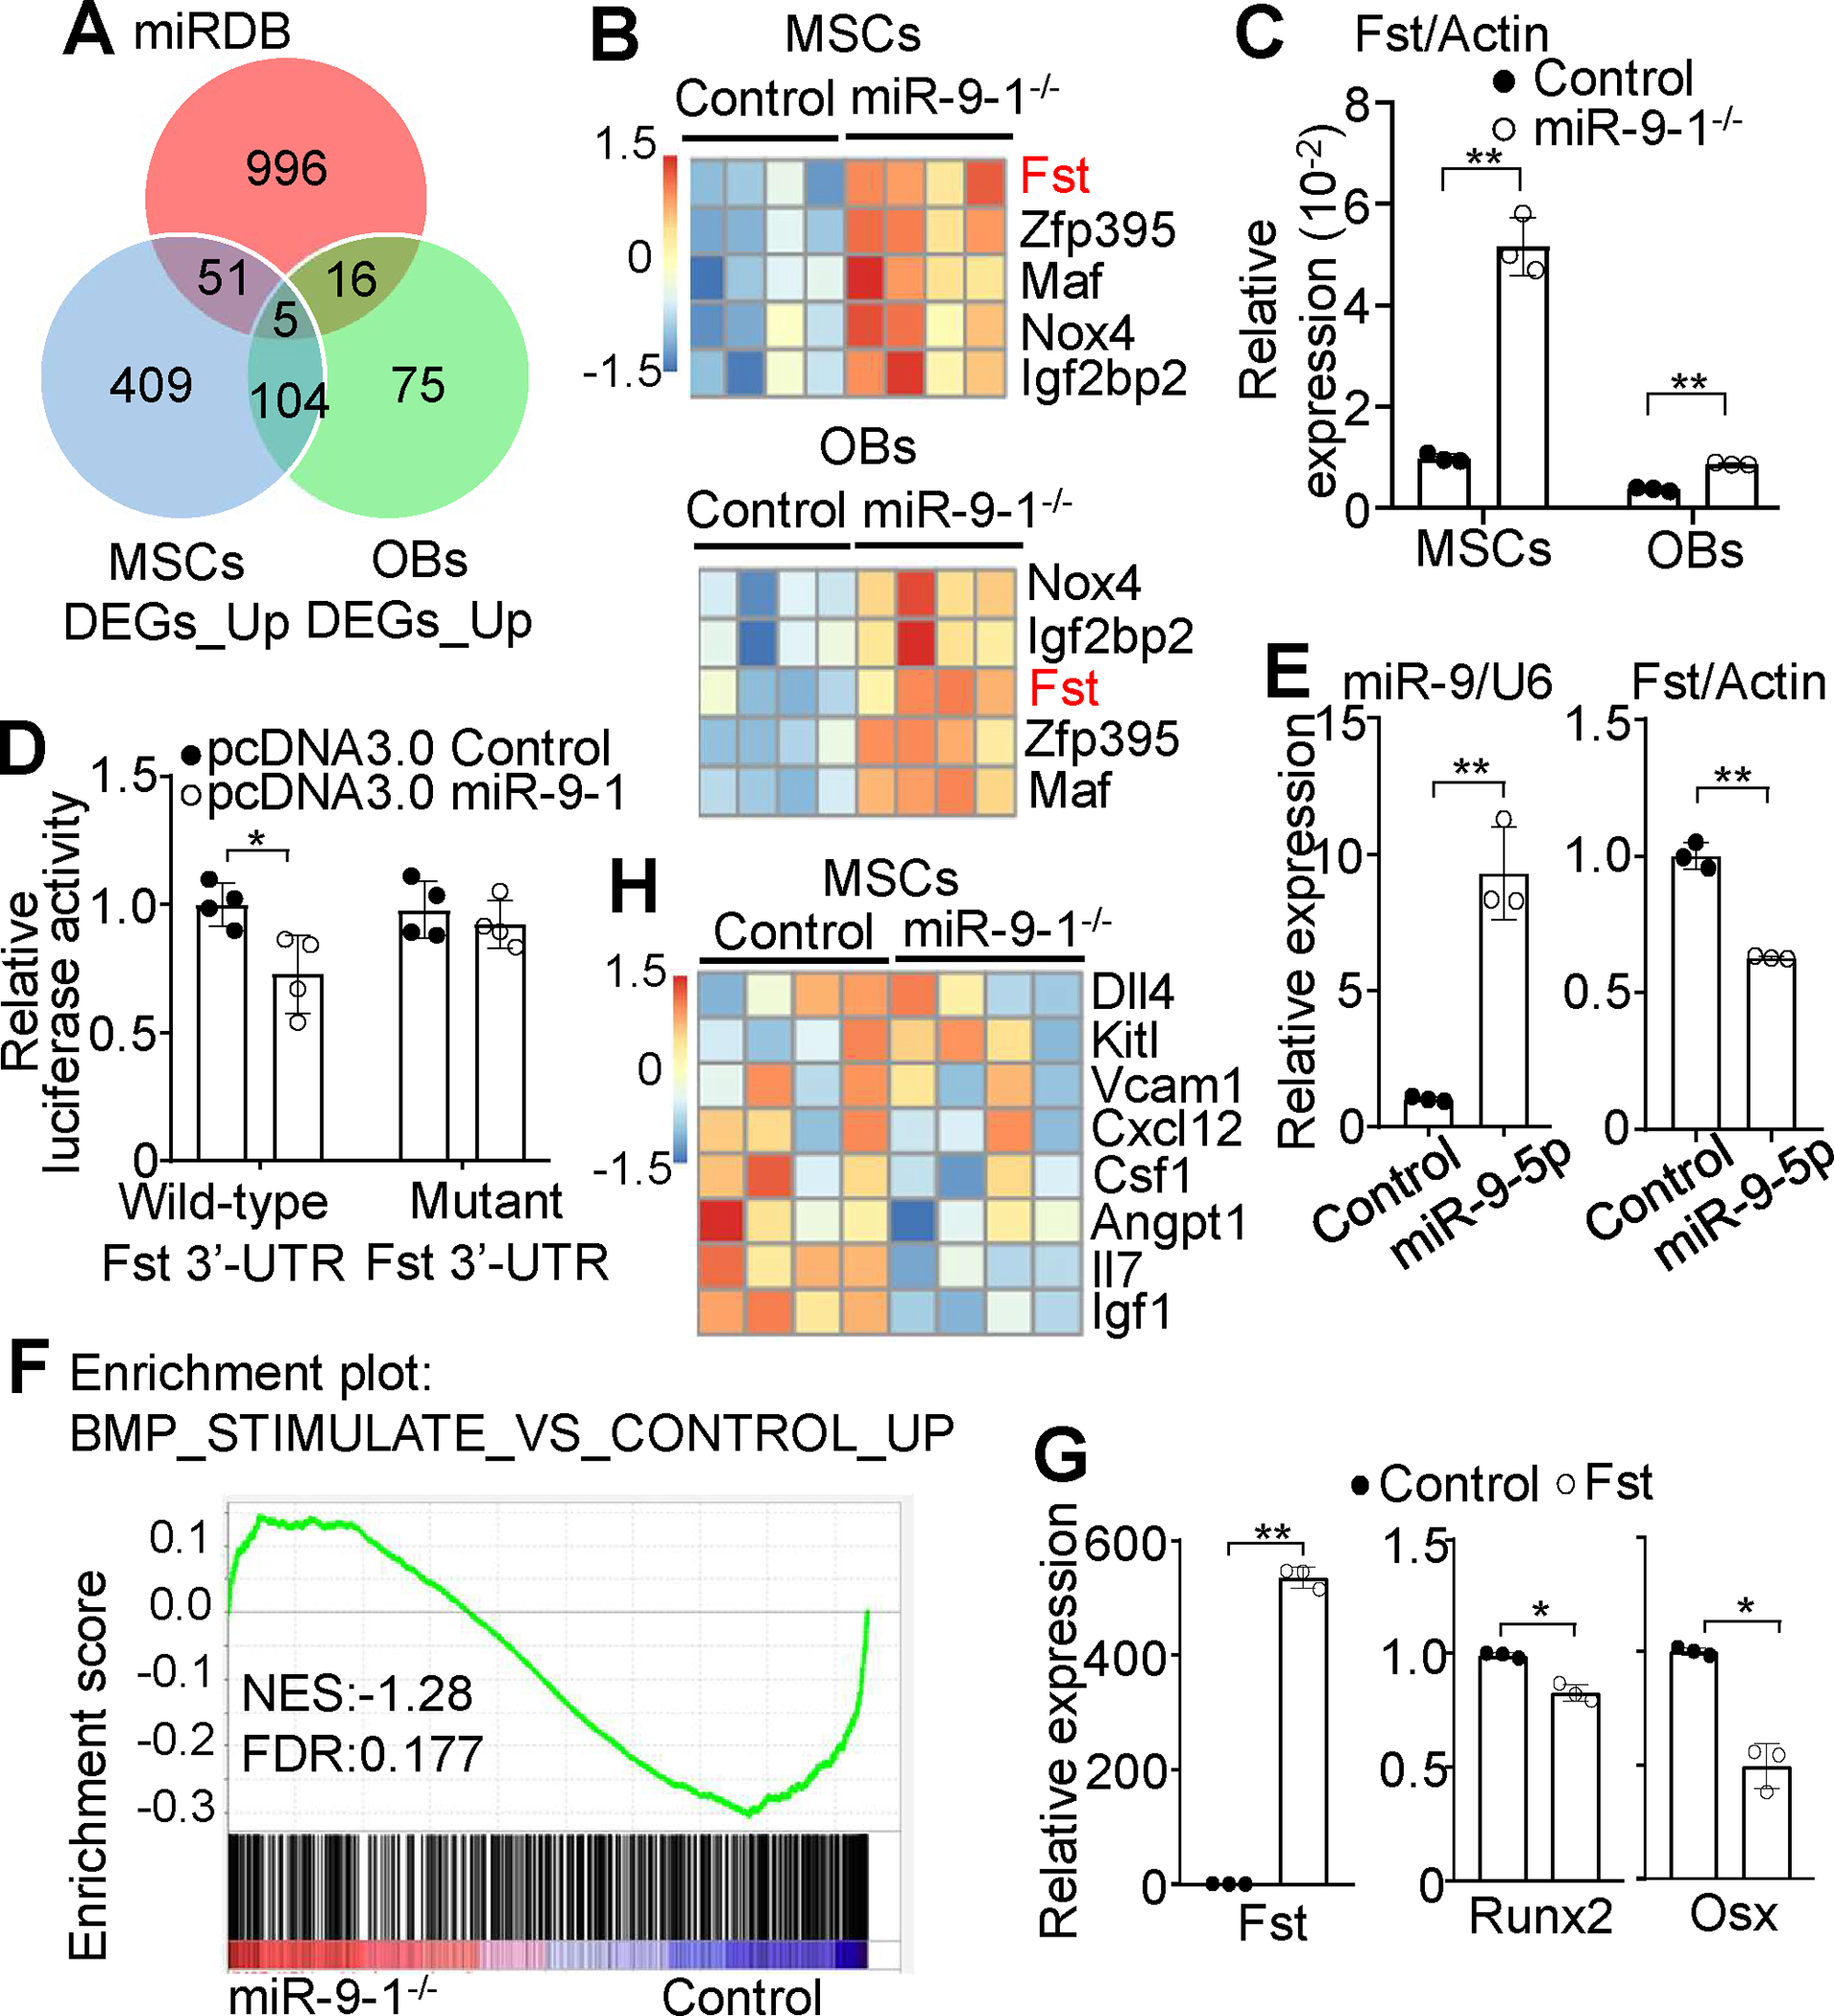
Fig. 7. MiR-9-5p directly targets Fst to regulate BMP signaling in MSCs.

A Venn diagram showing the overlap among genes with miR-9-binding sites predicted by miRDB in the 3’-UTR and genes upregulated in miR-9-1-deficient relative to control MSCs and OBs. B Differential gene expression analysis of RNA-seq data showing increased levels of Fst mRNA in miR-9-1−/− relative to control MSCs and OBs. C qRT–PCR confirming increased levels of Fst mRNA in miR-9-1−/− relative to control MSCs and OBs. The relative mRNA levels of Fst in miR-9-1−/− and control MSCs and OBs were normalized to Actin. D Suppression of the Renilla luciferase activity of the reporter with wild-type 3’-UTR of Fst but not mutant by miR-9-5p. The level of luciferase activity in 293T cells transfected with the luciferase reporter vector containing the wild-type or mutant 3′-UTR of Fst with miR-9-5p was quantified by the luciferase assay as a fraction of the corresponding control cells transfected with the luciferase reporter vector containing the wild-type 3′-UTR of Fst with empty vector, which was set as 1. E Reduced level of endogenous Fst mRNA in primary MSCs by miR-9-5p overexpression. The expression levels of miR-9-5p and Fst in MSCs transfected with empty pcDNA3.0 vector (control) or miR-9-5p expression pcDNA3.0 (miR-9-5p) was determined by qRT-PCR with U6 small nuclear RNA or Actin as the internal control, respectively. F Downregulation of the genes related to BMP stimulation in miR-9-1-deficient MSCs. Comparative GSEA of the BMP stimulation-related gene signatures in sorted primary miR-9-1-deficient and control CD51+Sca1+ MSCs. G Effect of Fst overexpression on Runx2 and Osx expression. The relative expression levels of Fst, Runx2 and Osx were compared between wild-type MSCs overexpressing Fst (Fst) and wild-type MSCs transfected with empty vector (control) by qRT-PCR analysis. H Differential gene expression analysis of RNA-seq data showing decreased levels of IL-7 and IGF-1 mRNA in miR-9-1−/− relative to control MSCs. Data shown are representative of or obtained from 4 (A, B, F, H) and 3 (E, G) miR-9-1−/− and control mice, and representative of or obtained from 4 independent experiments (C, D). Each dot represents one biological replicate or an individual mouse. Mean ± SD is shown. *, p < 0.05; **, p < 0.01.
