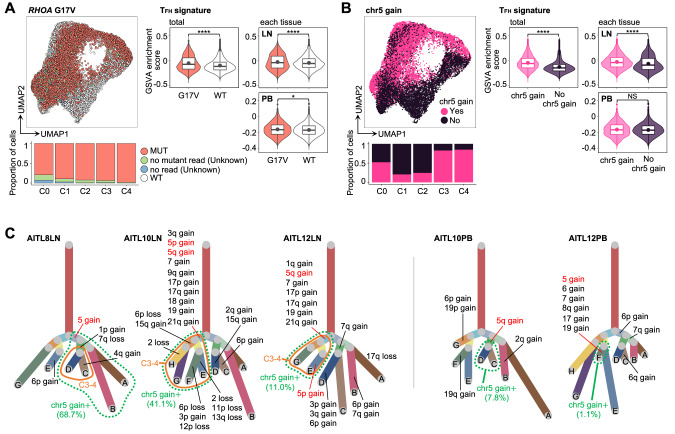
Fig. 3. Estimation of genomic alternations at the single-cell level.
A Distribution of RHOA G17V (G17V) mutant cells (left panel) and comparison of GSVA enrichment score for the TFH signature between G17V mutant (red) and wild-type (WT, white) cells (right panel) in LN and PB tumor cells. In the violin plots of the right panel, adjusted P values are calculated for all tumor cells (left) and each tissue (right). “Unknown” cells had no mutant reads or no coverage. “WT” cells were from TFHL patients without G17V mutations by WES. MUT, mutant cells. B Distribution of tumor cells with chromosome (chr)5 gain (left panel) and comparison of GSVA enrichment score for the TFH signature between tumor cells with chr5 gain (pink) and those without (blue) (right panel). In the violin plots of the right panel, adjusted P values are calculated for all tumor cells (left) and each tissue (right). NS, not significant. C Phylogenetic trees based on copy number variation (CNV) patterns identified by inferCNV [35] in TFHL LN (left panel) and PB (right panel) samples with partial chr5 gain. All boxplots show the median (center line), mean (center dot), interquartile range (box limits), and minimum to max values (whiskers) for each group. *P < 5.0 × 10⁻², ****P < 1.0 × 10⁻⁴.

