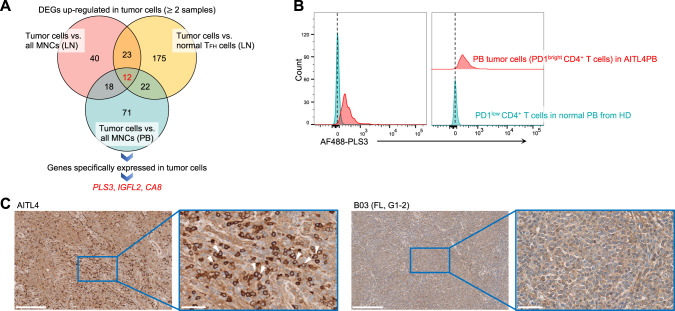
Fig. 4. Identification of novel tumor-specific cell markers.
A Overview of tumor-specific cell marker identification. For both LN (n = 9) and tumor cell-bearing PB (n = 12) samples, differentially expressed gene (DEG) analysis was performed to select genes whose expression was significantly elevated in tumor cells of two or more samples versus (vs.) all MNCs or normal TFH cells (for only LN tumor cells) for all samples. Next, genes specifically expressed in tumor cells were selected by manual inspection using UMAP plots. B Representative FCM plots of PLS3 expression in PD1bright CD4+ cells from PB of TFHL (AITL4, red) and PD1dim CD4+ cells from PB of a healthy donor (HD, blue). C Representative images of PLS3 expression by immunohistochemical staining of FFPE samples from TFHL (AITL4, left) and B-cell lymphoma (B03, right). White triangles indicate tumor cells expressing PLS3 on the cell membrane surface. Images were scanned using the NanoZoomer (2.0HT, Hamamatsu Photonics, Shizuoka, Japan) and acquired at ×10 and ×40 with the NDP.view.2 software (v2.9.29). FL, follicular lymphoma; G, grade of FL according to the 4th edition of the World Health Organization classification [1]; Scale bar, 250 μm (left) and 50 μm (right).

