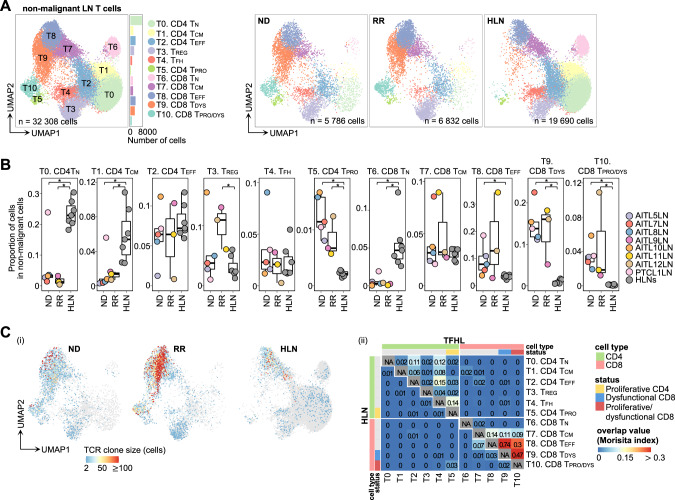
Fig. 5. Subclustering of non-malignant T cells from LNs.
A UMAP plots of non-malignant LN T cell subclusters. Cells are shown separately for each clinical status (right panels). TCM, central memory T cell; TDYS, dysfunctional T cell; TEFF, effector T cell; TN, naïve T cell; TPRO, proliferative T cell; TPRO/DYS, proliferative dysfunctional T cell; TREG, regulatory T cell. B Comparison of proportions of each cluster in non-malignant MNCs per sample. The boxplots show the median (center line), interquartile range (box limits), minimum to max values (whiskers), and samples (dots) for each group. P values are shown only for significant differences. *P < 5.0 × 10⁻². C Clone size (i) and overlap analysis (ii) of TCRs in non-malignant LN T cells. The number of cells expressing each clonotype was defined as clone size and illustrated for each cell. The “repOverlap” function of Immunarch measured the TCR sharing between each cluster, analyzed and illustrated for TFHL LNs (upper right) and HLNs (lower left), respectively.

