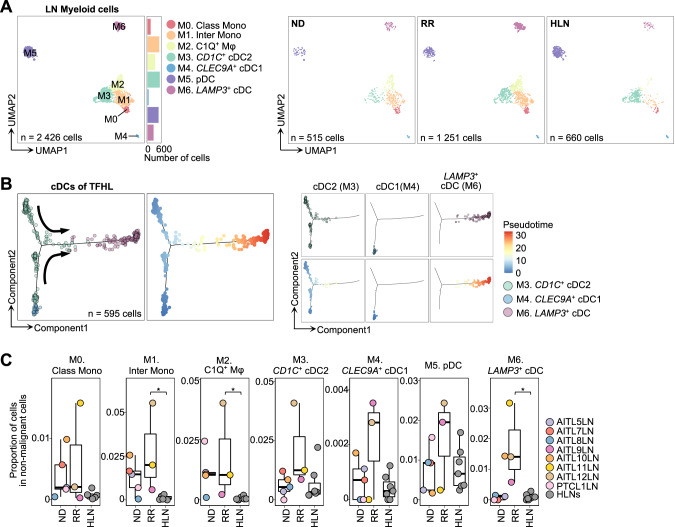
Fig. 6. Subclustering of myeloid cells from LNs.
A UMAP plots of LN myeloid cell subclusters. Cells are shown separately for each clinical status (right panels). C1Q+ Mφ, complement component C1q positive macrophage; CD1C+ cDC2, CD1C-positive type2 conventional dendritic cell; Class Mono, classical monocyte; CLEC9A+ cDC1, CLEC9A-positive type1 cDC; Inter Mono, intermediate monocyte; LAMP3+ cDC, LAMP3-positive cDC; pDC, plasmacytoid DC. B Trajectory inference by Monocle2 for cDCs of TFHL, color-coded by cluster (left of the left panel) and pseudo-time (right of the left panel). Cells are shown separately for each cluster (right panel). C Comparison of proportions of each cluster in non-malignant MNCs per sample. The boxplots show the median (center line), interquartile range (box limits), minimum to max values (whiskers), and samples (dots) for each group. P values are shown only when there is a significant difference. *P < 5.0 × 10⁻².

