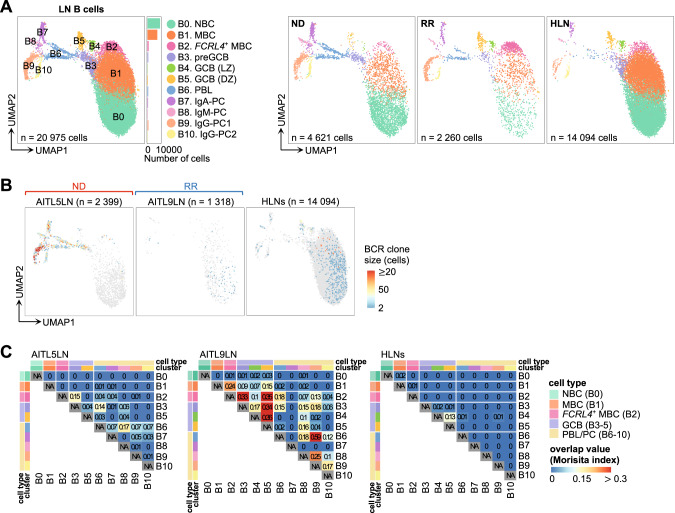
Fig. 7. Subclustering of B cells from LNs.
A UMAP plots of LN B cell subclusters. Cells are shown separately for each clinical status (right panels). FCRL4+ MBC, FCRL4-positive memory B cell; GCB (DZ), germinal center B cell in the dark zone; GCB (LZ), GCB in the light zone; MBC, memory B cell; NBC, naïve B cell; PBL, plasmablast; PC, plasma cell; preGCB, pre-germinal center B cell. B Clone size of BCRs in B cells from AITL5LN, AITL9LN, and HLNs. The number of cells expressing each clonotype was defined as clone size and calculated for each sample. HLN samples are shown as integrated (right). C BCR overlap analysis of B cells from AITL5LN, AITL9LN, and HLNs. AITL5LN and AITL9LN were analyzed individually while HLN samples were analyzed after integration.

