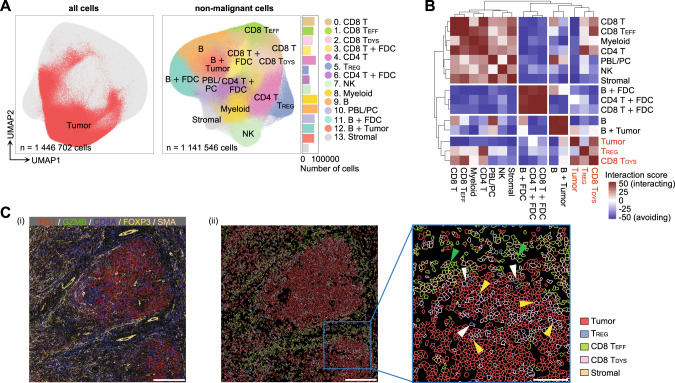
Fig. 8. Cell-cell interaction analysis between tumor and immune cells from TFHL tissues.
A UMAP plots of all (left) and non-malignant (right) cells detected by single-cell segmentation of IMC data from 10 FFPE samples of TFHL tissues. The tumor-cell cluster, identified by unsupervised clustering of all cells, is colored in red (left). The non-malignant cells are color-coded by subclusters identified by unsupervised clustering without the tumor-cell cluster (right). FDC, follicular dendritic cell; Stromal, stromal cell; +, a mixture of two cell types. B Spatial interaction analysis for each cell type using IMC data of TFHL tissues. Higher interaction scores indicate closer distance and more interaction between cells, whereas lower scores indicate farther distance and less interaction. C Representative IMC images (P5) color-coded by (i) expression levels of markers for CD8 TDYS (PD1), CD8 TEFF (GZMB), TREG (FOXP3), and stromal cells (SMA) and (ii) cell types identified by clustering at the single-cell resolution. In panel (ii), only tumor cells, stromal cells, TREG (white arrowheads), CD8 TEFF (green arrowheads), and CD8 TDYS (yellow arrowheads) are shown. Scale bar, 300 μm ((i) and left of (ii)) and 100 μm (right of (ii)).

