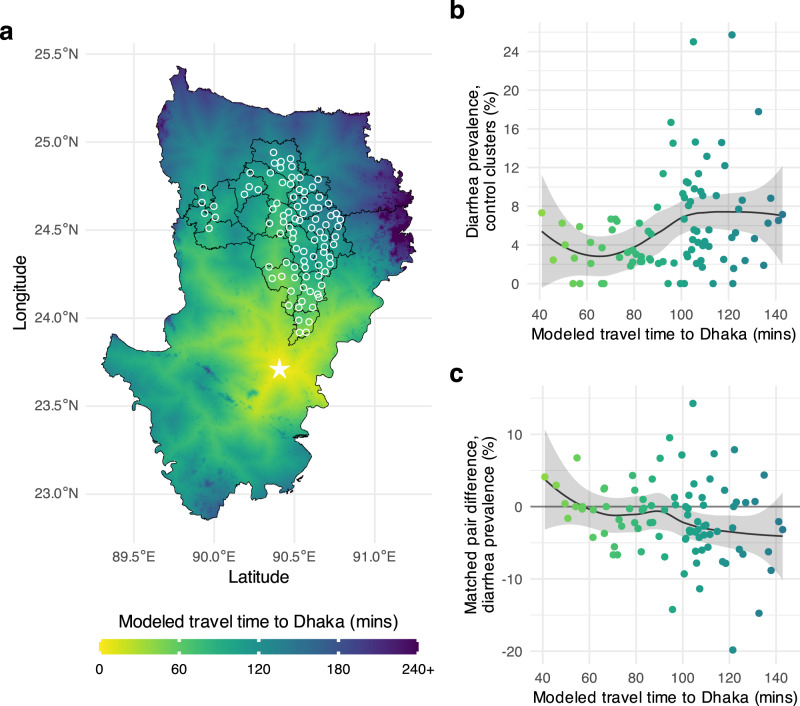
Fig. 6. Heterogeneity in the effect of nutrition on diarrhea prevalence by travel time from Dhaka, Bangladesh.
a Modeled travel time in minutes at 1 km2 resolution between Dhaka (marked by a star) and the 90 WASH Benefits Bangladesh matched pair centroids (white circles). Black lines mark subdistricts (zillas). b Diarrhea prevalence in control clusters by travel time to Dhaka. The line represents a non-parametric locally weighted regression fit, and the shaded band its approximate pointwise 95% confidence interval c Matched pair differences in diarrhea prevalence (nutrition – control) by travel time to Dhaka. The line represents a non-parametric locally weighted regression fit, and the shaded band its approximate pointwise 95% confidence interval. In panels b and c, points are colored by the surface in panel a. Created with notebook https://osf.io/fmgex.

