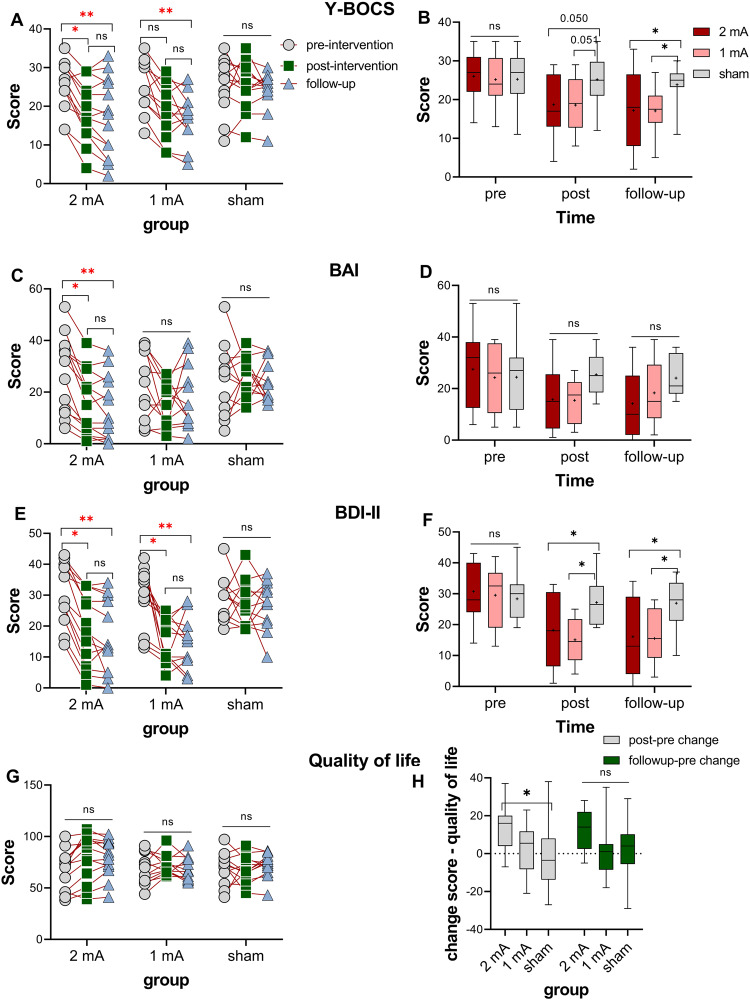
Fig. 3. Clinical examination.
OCD symptoms measured by Y-BOCS (A, B) and treatment-related variables (C–H) (anxiety measured by BAI, depressive state measured by BDI-II, and quality of life measured by the WHO quality of life scale), before and immediately after intervention and 1-month follow-up. Y-BOCS Yale-Brown Obsessive-Compulsive Scale, BAI Beck Anxiety Inventory, BDI-II Beck Depression Inventory-II. Floating asterisks [*] in the left panel represent a significant difference between pre-intervention measurement vs post-intervention and follow-up measurements in all groups. Floating asterisks [*] in the right-side figures indicate a significant difference between active stimulation groups (1 and 2-mA) vs sham tDCS at each time point. ns non-significant. All pairwise comparisons were conducted using Dunnett’s multiple comparisons. All error bars represent s.e.m.

