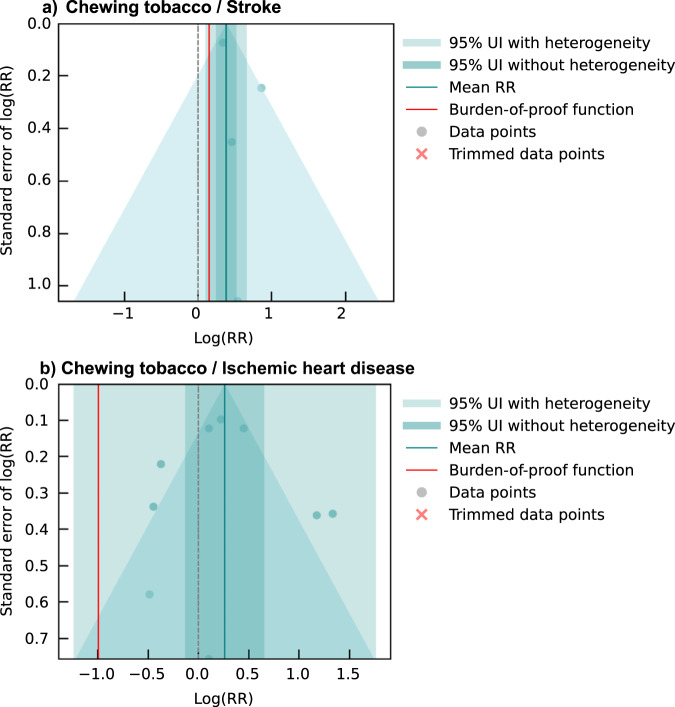
Fig. 2. Modified funnel plots for chewing tobacco and two cardiovascular disease outcomes.
These modified funnel plots show the residuals of the reported mean relative risk (RR) relative to 0, the null value, on the x-axis and the residuals of the standard error, as estimated from both the reported standard error and gamma, relative to 0 on the y-axis for the association between chewing tobacco and stroke (panel a) and between chewing tobacco and ischemic heart disease (panel b). The light blue vertical interval corresponds to the 95% uncertainty interval incorporating between-study heterogeneity; the dark blue vertical interval corresponds to the 95% uncertainty interval without between-study heterogeneity; the dots are each included observation; the red Xs are outliered observations if relevant; the grey dotted line reflects the null log(RR); the blue line is the mean log(RR) for chewing tobacco and the outcome of interest; the red line is the burden of proof function at the 5th quantile for these harmful risk-outcome associations.

