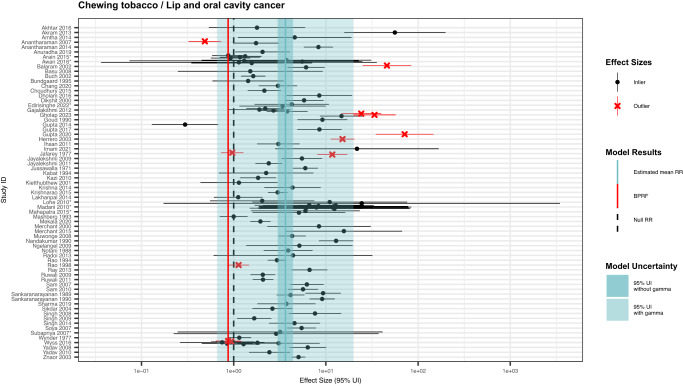
Fig. 6. Forest plot of underlying data for chewing tobacco and lip and oral cavity cancer.
This forest plot depicts the estimated mean relative risk (blue vertical line) and its 95% uncertainty interval (blue shaded intervals) for the association between chewing tobacco and lip and oral cavity cancer and the data points used to produce our primary results. The narrower darker blue interval corresponds to the 95% uncertainty interval estimated without accounting for between-study heterogeneity in accordance with traditional meta-analytic approaches. The light blue interval corresponds to the 95% uncertainty interval that incorporates between-study heterogeneity and the uncertainty around it in alignment with our Burden of Proof meta-analytic approach. Similarly, the red vertical line is the Burden of Proof Risk Function (BPRF), which corresponds to the 5th quantile and is the estimate from which our risk-outcome score (ROS) is derived for risk-outcome pairs in which the darker blue interval (the 95% uncertainty interval without between-study heterogeneity) does not include the null value at relative risk = 1. The black dotted vertical line reflects the null relative risk at 1. The black data points and horizontal lines each correspond to an effect size and 95% uncertainty interval from the study noted in on the y-axis that was included in the model. The red Xs and horizontal lines correspond to effect sizes and 95% uncertainty intervals from the studies on the y-axis that were automatically trimmed by the trimming algorithm based on deviation from the mean. Studies noted with an asterisk include effect sizes from overlapping samples whose uncertainty interval was scaled based on the number of overlapping observations to avoid overrepresenting one sample in the model.

