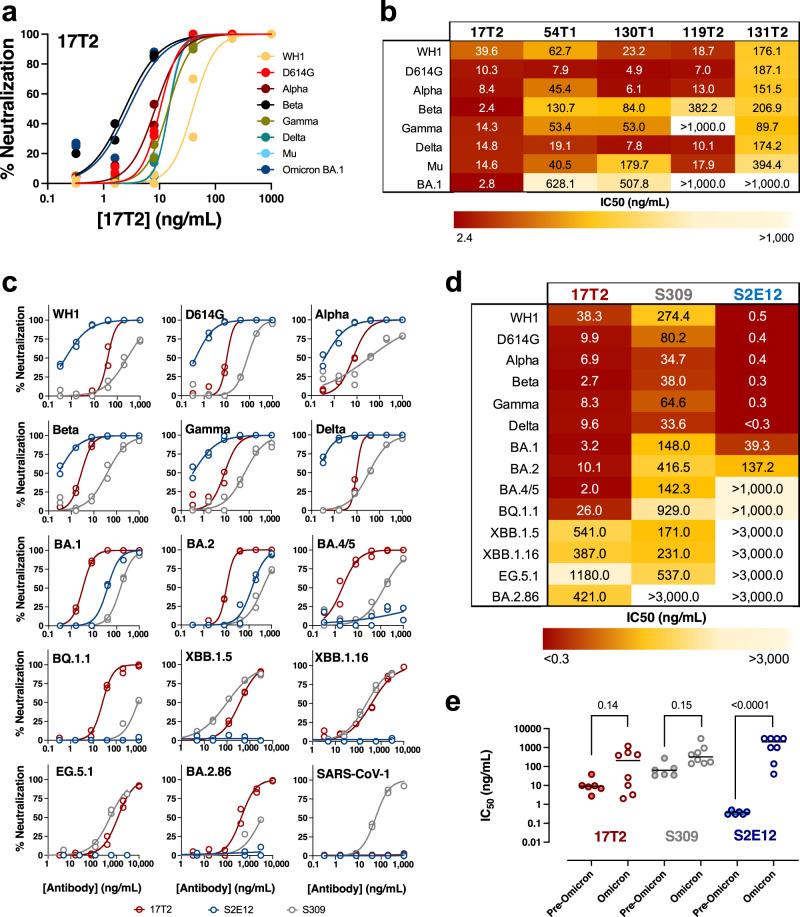
Fig. 1. Pan-neutralizing activity of 17T2 mAb.
a Neutralization curves of 17T2 mAb against HIV-1 based pseudoviruses expressing the indicated SARS-CoV-2 spike variants. Duplicate values corresponding to a representative experiment out of two are shown. b Heatmap showing the neutralization activity as IC50 values of the selected mAbs against the indicated SARS-CoV-2 pseudoviruses. Values are in ng/mL, darker color corresponds to higher potency as indicated in the bottom of the Figure. c Neutralization curves of 17T2 (red), S309 (gray) and S2E12 (blue) mAbs against the indicated SARS-CoV-2 variants or SARS-CoV-1 (all exposed on the surface of HIV-1 based pseudoviruses). Duplicate values corresponding to a representative experiment out of at least two are shown. d Heatmap showing IC50 values from panel C in ng/mL. As in (b), darker color corresponds to higher potency as indicated in the bottom of the Figure. e Impact of Omicron subvariants on pseudovirus neutralization capacity. IC50 values for pre-Omicron variants (WH1, D614G, Alpha, Beta, Gamma, and Delta) were grouped (n = 6) and compared to Omicron subvariants (BA.1, BA.2, BA.4/5, BQ.1.1, XBB.1.5, XBB.1.16, EG.5.1 and BA.2.86; n = 8). Solid bars show the geometric mean. P values show individual corrected comparisons for each antibody using two-sided Kruskal-Wallis test with a global p value of <0.0001. Source data are provided as a Source Data file.

