Figure 7.
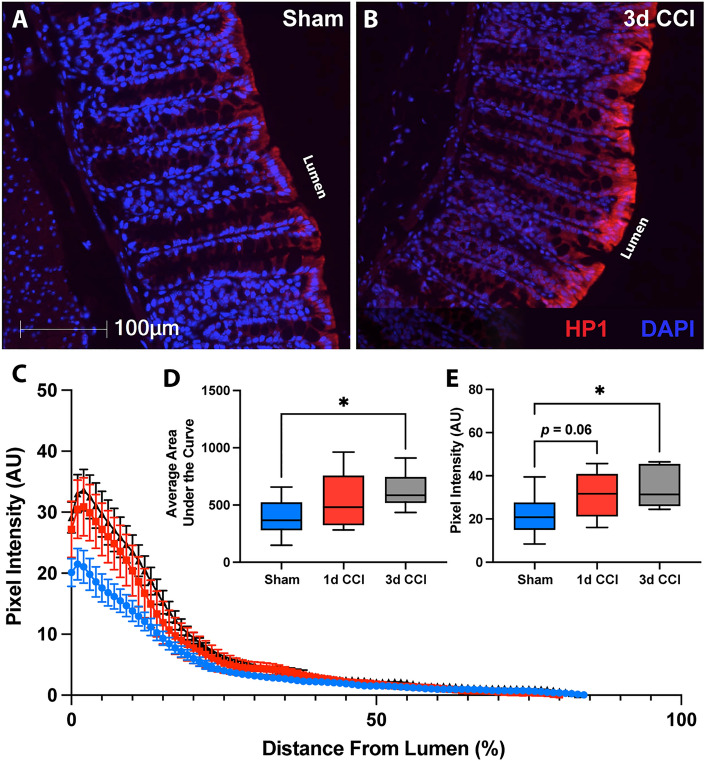
CCI induces colon hypoxia at 3 d post-injury. Representative images of hypoxyprobe-1 staining (HP1, red) in the colon of (A) sham and (B) 3 d post-CCI mice. (C) Traces of hypoxia intensity as a function of distance from the lumen, averaged from three crypts within three randomly selected fields of view from sham (blue), 1 d CCI (red), and 3 d CCI (black). (D) Area under the hypoxia intensity curve is increased at 3 d post-CCI compared to sham mice. (E) Peak hypoxia is also increased at 3 d post-CCI. Whiskers represent minimum and maximum, box represents 25th–75th percentile, and line represents median value (*p < 0.05; nsham = 11, nCCI = 6–7/timepoint).

