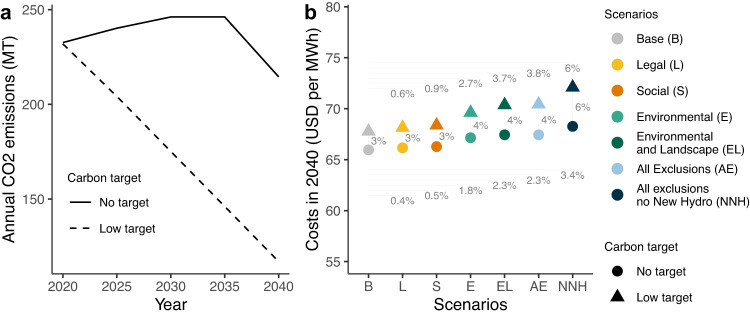
Fig. 4. Annual carbon dioxide (CO2) emissions and electricity systems costs in 2040.
a Carbon dioxide emissions expressed in megatonnes (MT) and (b) 2040 costs of Southern Africa’s electricity system for the no-carbon target and low-carbon target scenarios expressed in US dollars (USD) per megawatt-hour (MWh). Carbon emissions for all scenarios are either capped at the Base scenario without an emissions reduction target or the Base scenario with a low carbon emissions target trajectory. Carbon emissions in the low-carbon scenarios are capped at levels that linearly decline over time to meet a 50% emissions reduction target by 2040 compared to 2020. Cumulative emissions between 2020 and 2040 are 28% lower in the low-carbon target scenarios (3500 vs. 4850 MT CO2). Annual emissions in 2040 are nearly 50% lower in the low-carbon target scenarios. Horizontal lines and corresponding percentages at the ends of each line show the relative cost increase between each scenario and the Base scenario (b). Vertical lines and the corresponding percentages show the cost increases between the no-carbon target and the low-carbon target scenarios (b). Source data are provided as a Source Data file.

