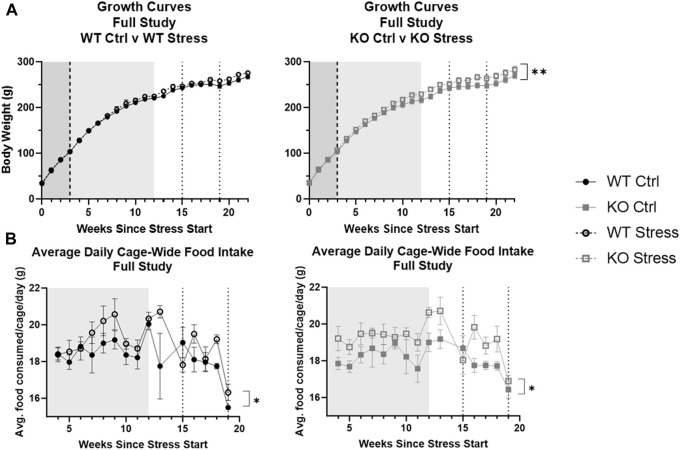
FIGURE 2.
Stress exposure increased body weight (A) and food intake (B) over time, with a larger effect in KO rats. Data are split by genotype to assess differences due to stress exposure respective for WT and KO rats. Increases in body weight were found in Krtcap3 knock-out (KO, gray square) rats but not in wild-type (WT, black circle) rats. While increases in food intake also appear to be driven by KO rats, a larger n is needed. The mild stress period is demarcated by the shaded region from weeks 0–3 (white noise, dark gray) and from weeks 3–12 (white noise + additional mild stress, light gray), while the dotted lines at weeks 15 and 19 indicate the beginning and end of UCMS. High fat diet start is shown by the dashed line 3 weeks after the start of stress. Cage-wide food intake was measured from time of diet start to end of UCMS (4–19 weeks of stress exposure). **p < 0.01 represents an interaction between body weight and time only in the KO rats and *p < 0.05 is for the interaction between food intake and time based on the 2-way repeated measures ANOVA.

