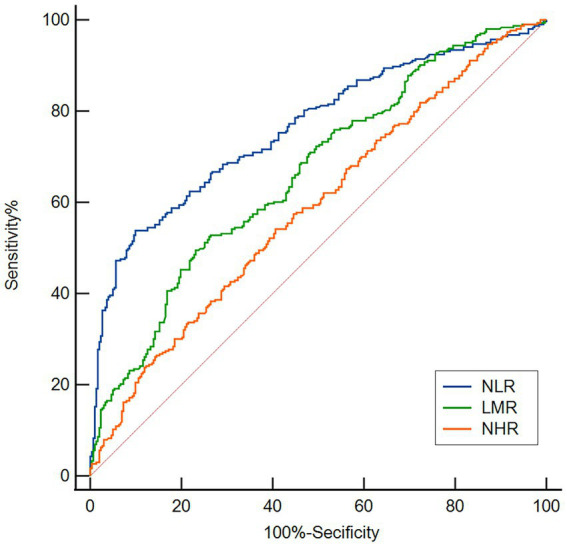
Figure 6.

ROC curves for evaluating the utility of the plasma NLR, LMR, and NHR in discriminating PD patients from HCs. Based on the ROC curve analysis, the NLR, LMR and NHR exhibited respectable PD discriminating power, with AUC values of 0.763, 0.665 and 0.588, respectively.
