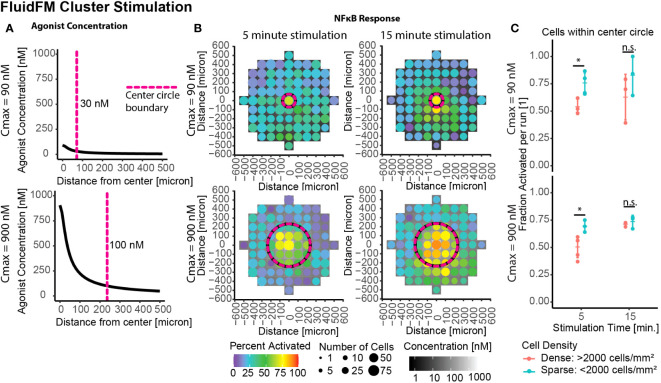
Figure 4.
Increased stimulation time restores activation in dense clusters. Cluster stimulation with FluidFM at different stimulation times. (A) Concentration gradient during dispensing for Cmax = 90 nM, 900 nM. Vertical dashed line marks where concentration drops below 30 nM (top) or 100 nM (bottom), cutoffs chosen based where activation drops below 50% for that stimulation condition (Supplementary Figure 3A). (B) Cluster targeting with FluidFM, densely plated cells, each plot one representative experiment (Supplementary Figure 4A). Top row Cmax = 90 nM, bottom Cmax = 900 nM, left and right columns 5- and 15-min stimulation time. Data binned in 100 μm x 100 μm squares, tile background is agonist concentration, point color is percent activated and point size is the number of cells per bin. Circular dashed line corresponds to dashed line in (A). Negative control (top right) (C) Fraction activated in center per independent experiment, cutoff from calibration data (Supplementary Figure 1H). Grouped by stimulation condition (Cmax) and cell density. Significance from permutation ANOVA in R (Mulder et. al, STAR Protocols, in press). Stars indicate: * p ≤ 0.05, ‘ns’ p > 0.05.

