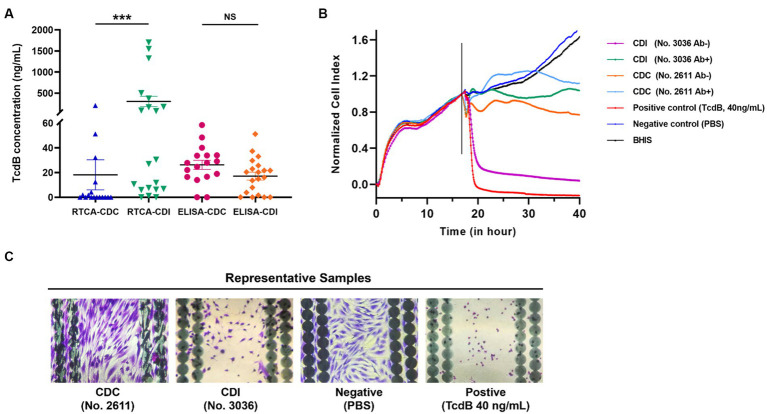
Figure 2.
Comparative analysis of functional and toxical TcdB concentrations from CDI and CDC clinical samples, along with representative nCI curves of both were presented. (A) TcdB in prepared supernatants from CDI and CDC fecal samples were detected by RTCA and ELISA, respectively. Functional and toxical TcdB concentrations measured by the RTCA were calculated using the nonlinear fitting curve y = 7.029x-0.433. ***p < 0.001, NS, not significant. (B) Representative differences in cell growth curves after inoculation with CDC and CDI samples on the RTCA. The vertical lines represented the nodes of RTCA normalized analysis. Ab+: samples incubated with neutralizing antibodies; Ab−: samples incubated without neutralizing antibodies. (C) Stained microscopic images of cells which were grown on the E-Plate wells after CDC and CDI samples were added.

