Figure 3.

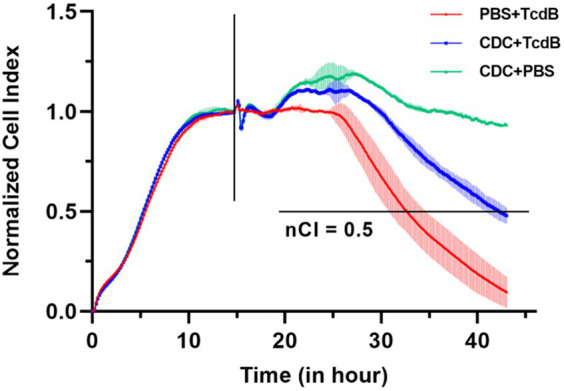
Pooled CDC supernatants inhibited TcdB activity. The vertical lines represented the nodes of RTCA normalized analysis, the horizontal line indicated the nCI 50% cutoff value.

Pooled CDC supernatants inhibited TcdB activity. The vertical lines represented the nodes of RTCA normalized analysis, the horizontal line indicated the nCI 50% cutoff value.