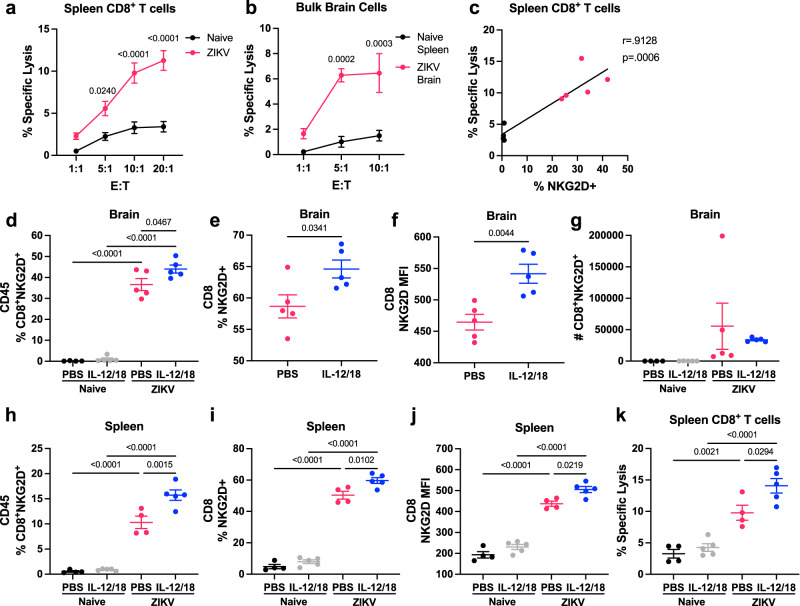
Fig. 6. ZIKV infection in mice generates bystander activated CD8+ T cells capable of antigen-independent cytotoxicity.
Ifnar-/- mice were infected with PBS (naïve) or 4x10⁵ PFU ZIKV via FTPD. a At 7 dpi, spleens were harvested and CD8+ T cells isolated by negative selection. A cytotoxicity assay was performed by incubating CFSE-labeled YAC-1 cells with spleen CD8+ T cells at various effector:target (E:T) ratios (n =4, 5, repeated once with similar results). Each datapoint represents the mean of technical duplicates. b Bulk brain cells from ZIKV-infected mice were pooled, with 5 brains per sample (n =3) and compared to cytotoxicity of CD8+ T cells isolated from naïve mouse spleens (n =3, repeated once with similar results). Each datapoint represents the mean of technical duplicates. c Correlation of the proportion of spleen CD8+ T cells that were NKG2D+ with specific lysis at the 20:1 E:T ratio. d–k Ifnar-/- mice were infected with PBS (naïve) or ZIKV and treated with PBS or IL-12/18 at 1 and 2 dpi. Brains were harvested for flow cytometry analysis and spleen CD8+ T cells were isolated for cytotoxicity assay at 7 dpi. d The proportion of brain CD45+ cells that were CD8+NKG2D+ (n =4, 5, 5, 5). e Proportion of brain CD8+ T cells from ZIKV-infected mice that were NKG2D+ (n =5). f MFI of NKG2D on brain CD8+ T cells from ZIKV-infected mice (n =5). g Count of CD8+NKG2D+ T cells in the brains of naïve and ZIKV-infected mice treated with PBS or IL-12/18 (n =4, 5, 5, 5). h Proportion of spleen CD45+ cells that were CD8+NKG2D+ (n =4, 5, 4, 5). i Proportion of spleen CD8+ T cells that were NKG2D+ (n =4, 5, 4, 5). j MFI of NKG2D on spleen CD8+ T cells (n =4, 5, 4, 5). k % specific lysis at 10:1 E:T ratios (n =4-5). Data represents mean ± SEM of one of two independent experiments with similar results (a, b, d–k). Statistical significance was determined by two-way ANOVA with Sidak’s multiple comparison test (a, b) or Tukey’s multiple comparison test (d, g–k), linear regression (c), and two-tailed Student’s t test (e, f). MFI mean fluorescence intensity. Source data are provided as a Source Data file.

