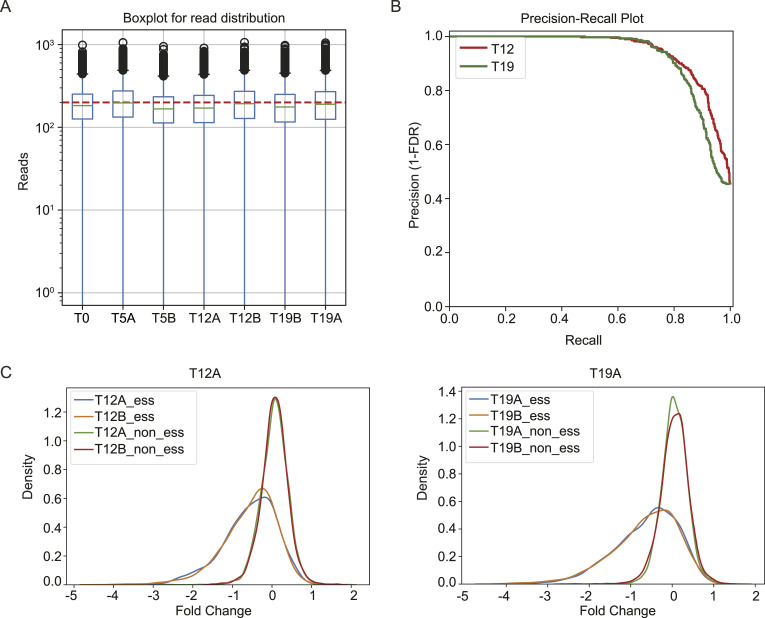
Figure S1. Quality control of CRISPR screen.
(A) Deep-sequencing reads distribution for MCF10A cell with radiation treatment samples. The distributions of each sgRNA are presented. (B) Precision-recall plots of essential genes identified from these screens. The dashed line marks the 5% FDR. (C) Changes in essential and nonessential genes during the CRISPR screens. Comparing time point 12 (T12A and T12B, two technical replicates) with 5 (T5) and time point 19 (T19A and T19B, two technical replicates) with 5 (T5), sgRNAs targeting essential genes changed dramatically, but no change in sgRNAs targeting nonessential genes was observed.

