FIGURE 4.
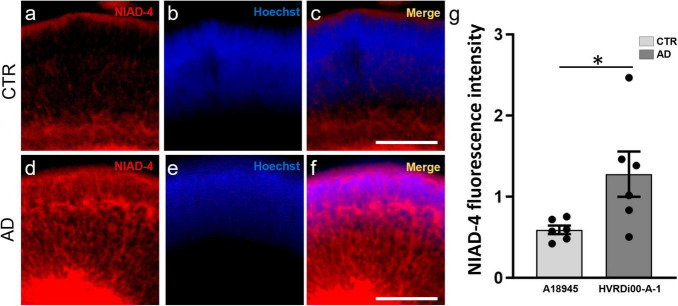
Quantitative assay to assess amyloid levels in 3D retinal organoids. Whole-mount retinal organoids (3 months post-differentiation) were stained with NIAD-4 for amyloid and with Hoechst, which labels all cells, for size normalization. (a–f) Whole mount imaging of stained organoids exemplifies the pattern of expression. Note the increased labeling in the AD-ROs (a,c) compared to CTR-ROs (d,f). (g) Total NIAD-4 fluorescence intensity was quantified in whole ROs using 3D-automated reporter quantification on a Tecan Spark multi-well plate reader and normalized to Hoechst after background subtraction. Bar graph shows significant increases in NIAD-4 labeling in AD-ROs (HVRDi001-A-1) compared to CTR-ROs (A18945) (individual data points represented by circles). n = 6 per condition; Mann–Whitney test, *p < 0.05. Bars represent mean ± SEM (error bars).

