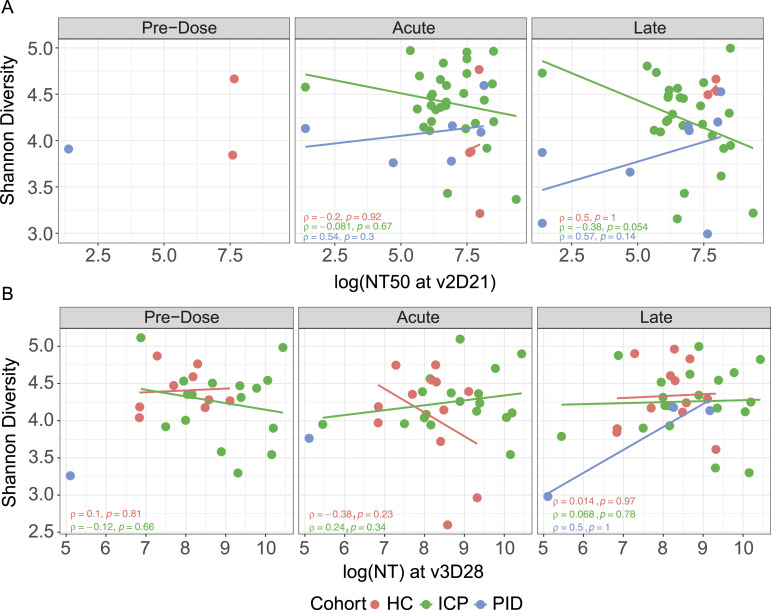
Figure 3. Vaccine efficacy is not correlated with the gut microbiome diversity.
Live-virus neutralisation capacity (NT) assessed against Shannon diversity of fecal samples, each point represents a different sample taken at one of the three vaccine timepoints. Colours represent cohorts, within healthy control, immune-checkpoint therapy-treated cancer patients (ICP) and patients with primary immunodeficiencies (PID). Correlated vaccine response through neutralisation capacity of patient serum taken at the peak of the second dose (v2D21) (N = 9 HC, 57 ICP, and 15 PID). (A) or third dose (v3D28) (N = 33 HC, 54 ICP, and 5 PID). (B) rho and P-values from Spearman’s Rank correlation testing displayed.

