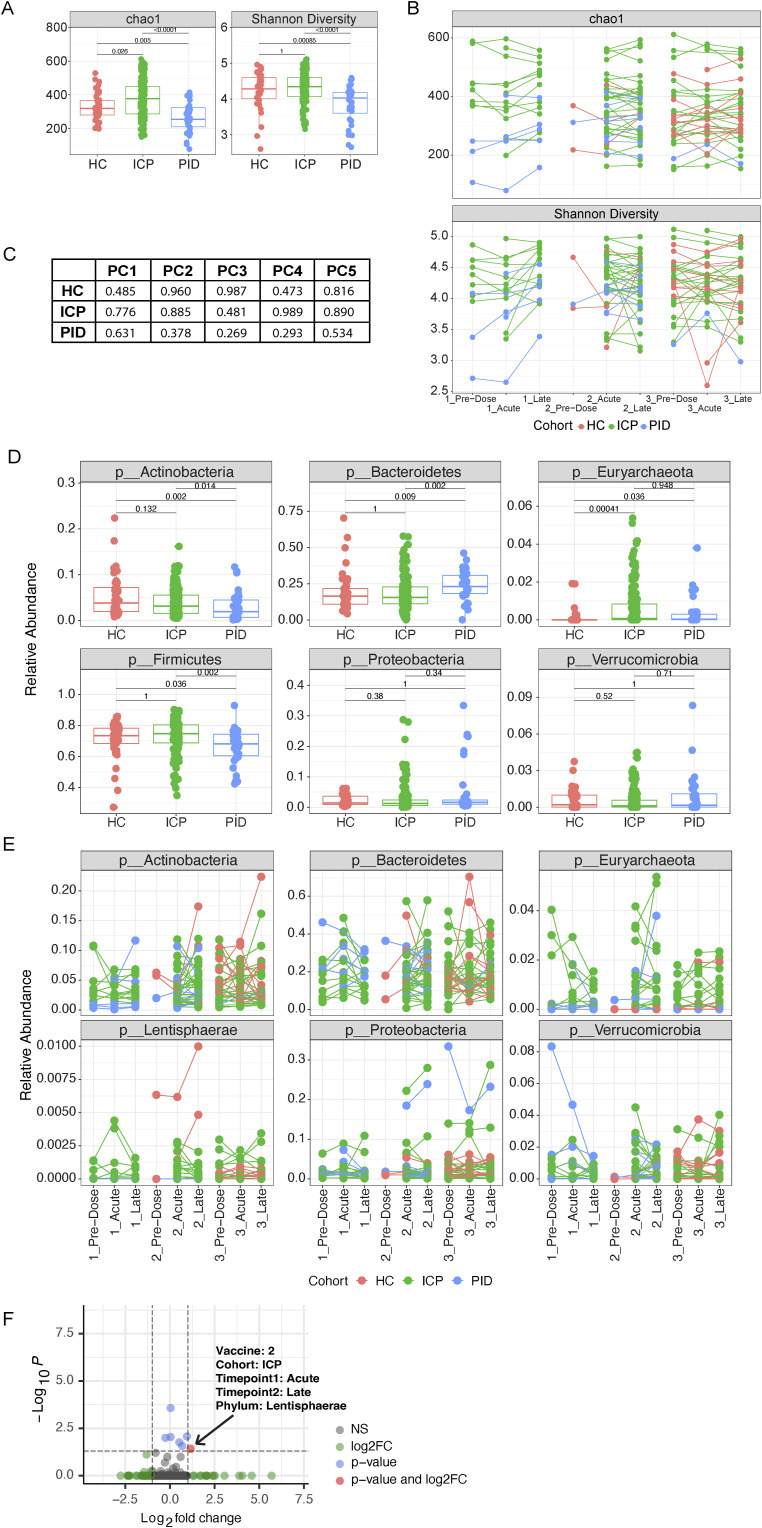
Figure S2. Gut microbiome compositional differences are evident between cohorts but not vaccine timepoints.
(A) Alpha diversity measures of chao1 and Shannon diversity in samples from different cohorts, healthy control, immune-checkpoint therapy-treated cancer patients (ICP), or patients with primary immunodeficiencies (PID) (N = 43 HC, 160 ICP, and 36 PID). (B) Paired analysis of the alpha diversity measures of patient samples taken from different vaccine timepoints from each of our cohorts (N = 40 HC, 153 ICP, and 31 PID). (C) Reported P-values of the linear model comparing baseline model of fixed patient effects on the explained variance, to the model using the vaccine timepoints of the patient samples as random effects when using the principal components (PC) (healthy controls [HCs], ICP, PID). (D) Relative abundance of the six most prevalent phyla in our patient samples from within each of our patient cohorts and separated by the vaccine timepoint from which the sample was taken (N = 43 HC, 160 ICP, and 36 PID). (E) Paired analysis of the six most prevalent phyla in our patient samples taken from different vaccine timepoints from each of our cohorts (N = 40 HC, 153 ICP, and 31 PID). (F) Volcano plot of the paired relative phylum abundance between two timepoints across all pair combinations unique to different vaccine doses and different cohorts. Colours represent the significance indicated in the legend. Statistical testing within figures was performed using Wilcoxon test and adjusted for multiple testing using bonferonni, paired where appropriate.

