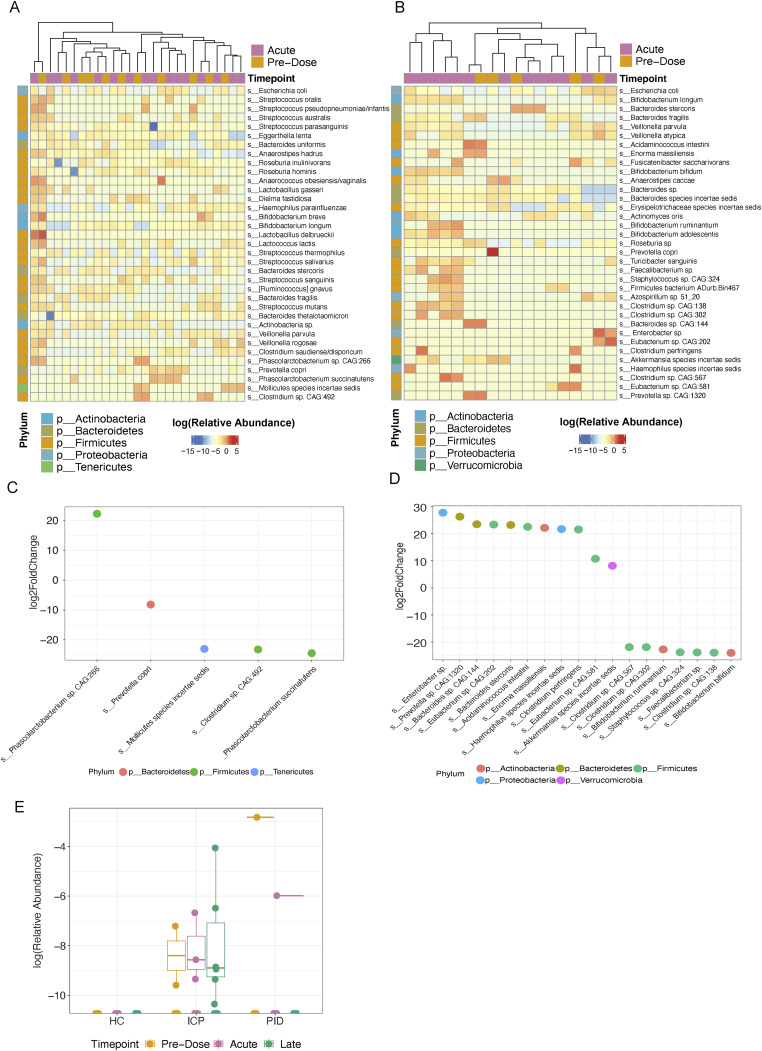
Figure S3. Differential abundance analysis of HC and PID cohort samples taken at pre-dose and acutely after COVID-19 vaccination.
(A, B, C, D) DESeq analysis of HC cohort (N = 11 Pre-Dose, 16 Acute) and PID cohort (N = 5 Pre-Dose, 13 Acute) (B), along with corresponding log2FoldChange of significantly different bacterial species between pre-dose and acute samples in HC samples (C) and PID samples (D), colours represent different phyla. (E) Relative abundance of Enterobacter sp. in our cohorts.

