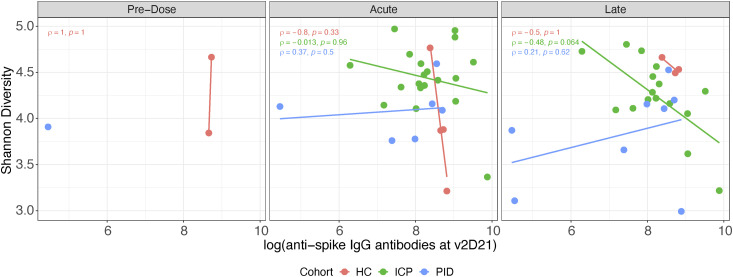
Figure S4. Absence of correlation between vaccine efficacy and gut microbiome composition.
Second dose anti-spike IgG antibody levels assessed against Shannon diversity of fecal samples; each point represents a different sample taken at one of the three vaccine timepoints. Colours represent cohorts, within healthy control, ICP and patients with PID. rho and P-values from Spearman correlation testing displayed (N = 9 HC, 35 ICP, and 15 PID).

