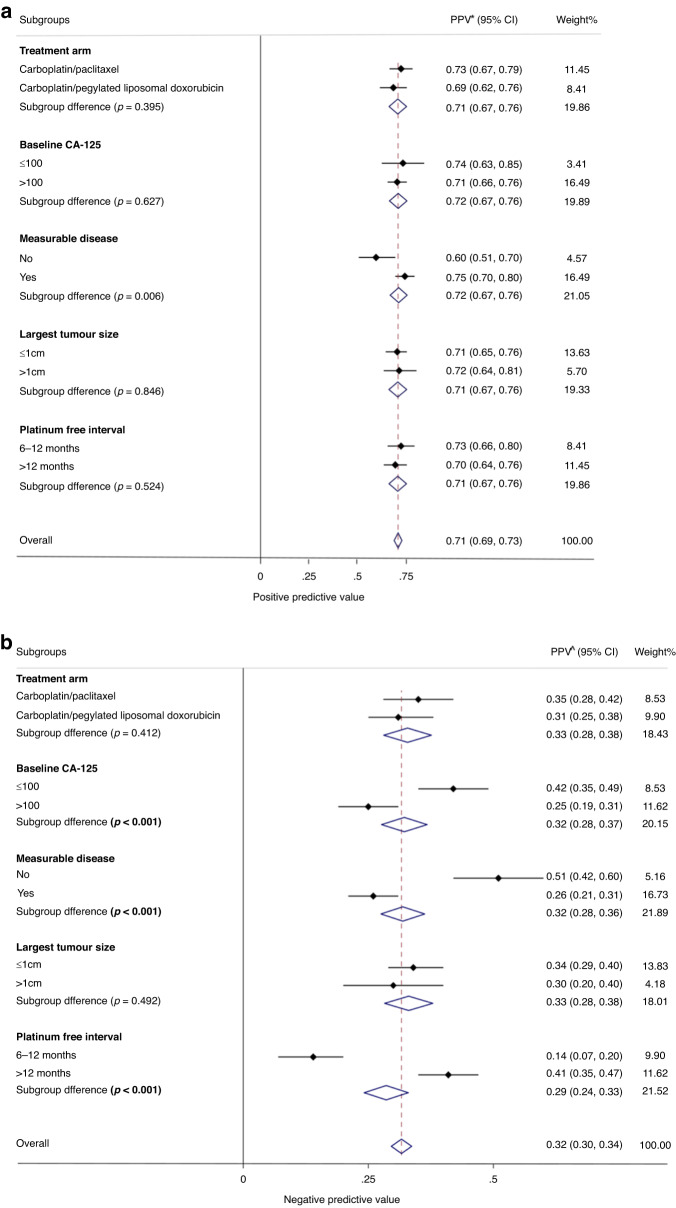
Fig. 3.
Forest plot showing (a) positive predictive values (PPV) and (b) negative predictive values (NPV) for primary analyses in patient subgroups. Concordance percentage for each subgroup variable, expressed as positive predictive value (a) and negative predictive value (b), is represented by the small diamond, and the horizontal line crossing the square represents the 95% confidence interval (CI). The large diamond represents the pooled overall measure of concordance. PPV positive predictive value (probability of patients with CA-125 PD that also had RECIST PD), NPV negative predictive value (probability that those without CA125 PD also did not have RECIST PD).

