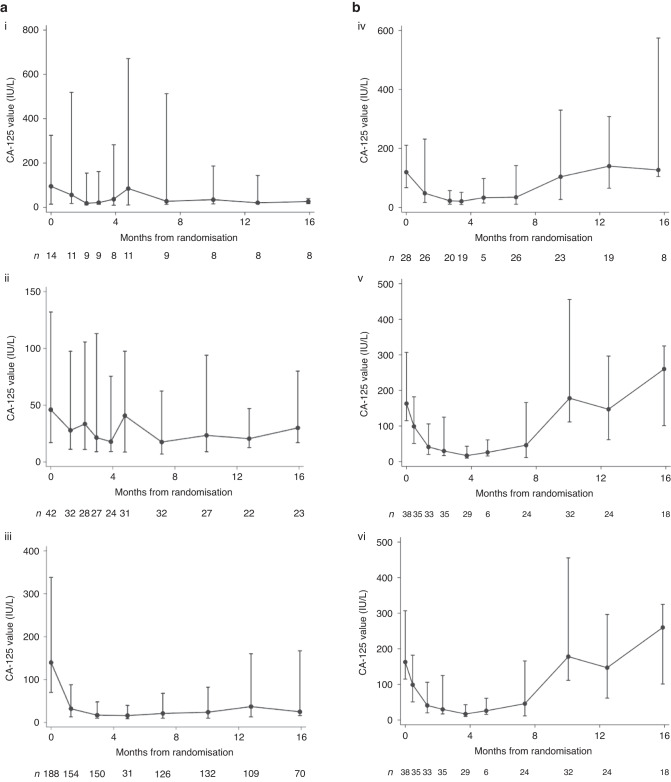
Fig. 4.
Scatter plots and median (IQR) for discordant groups: (a) Patients (N = 255) with RECIST PD only but CA-125 not meeting GCIG criteria for PD with (i) rising CA-125, (ii) stable CA-125, (iii) falling CA-125 values. b Patients (N = 111) with GCIG CA-125 PD only but without RECIST PD (iv) rising CA-125, (v) stable CA-125, (vi) falling CA-125 values. Dots represent the median CA-125 value at the particular time-point with bars representing the associated interquartile range. Patterns of CA-125 defined as: Rising CA-125 (>50% baseline at time of RECIST PD); Stable CA-125 (>15% below and ≤50% above baseline); Falling CA-125 (≤15% below baseline).

