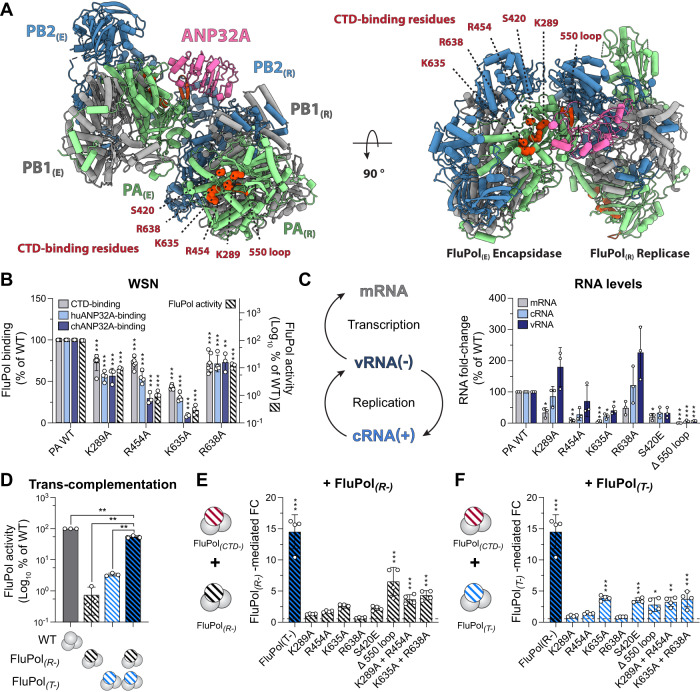
Fig. 1. The FluPol CTD-binding interface is essential for replication of the viral genome.
A Model of actively replicating Zhejiang-H7N9 FluAPol replicase-ANP32-encapsidase (FluPol(R)-ANP32A-FluPol(E)). Ribbon diagram representation with PA (green), PB1 (grey), PB2 (blue) and ANP32A (pink). The model was constructed by superposing Zhejiang-H7N9 elongating FluAPol domains (PDB: 7QTL)43 for the FluPol(R) and apo-dimer Zhejiang-H7N9 FluAPol (PDB: 7ZPL)43 for the FluPol(E), on those of FluCPol replication complex (PDB: 6XZQ)13. ANP32A was left unchanged. Key FluPol CTD-binding residues are highlighted on the FluPol(R) (left) and FluPol(E) (right). B WSN FluPol binding and activity assays in HEK-293T cells. Left Y-axis (linear scale): FluPol (PA WT or indicated PA CTD-binding mutants) binding to the CTD (grey bars), huANP32A (light blue bars) and chANP32A (dark blue bars) was assessed using split-luciferase-based complementation assays. Right Y-axis (logarithmic scale): FluPol activity (hatched bars) was assessed by vRNP reconstitution, using a model vRNA encoding the Firefly luciferase (Fluc-vRNA). The luminescence signals are represented as a percentage of PA WT (mean ± SD, n = 6, 4, 4, 3, **p < 0.002, ***p < 0.001 (one-way ANOVA; Dunnett’s multiple comparisons test). C WSN vRNPs were reconstituted in HEK-293T cells using the NA vRNA. Steady-state levels of NA mRNA, cRNA and vRNA were quantified by strand-specific RT-qPCR35 and are represented as a percentage of PA WT (mean ± SD, n = 3, *p < 0.033, **p < 0.002, ***p < 0.001, one-way repeated measure ANOVA; Dunnett’s multiple comparisons test). D–F FluPol trans-complementation assays upon vRNP reconstitution in HEK-293T cells with a model Fluc-vRNA. D Trans-complementation of a transcription-defective (FluPol(T-), PA D108A)8 and replication-defective (FluPol(R-), PA K664M)36 FluPol. Luminescence is represented as percentage of PA WT (mean ± SD, n = 3, **p < 0.002, one-way repeated measure ANOVA; Dunnett’s multiple comparisons test). WSN vRNPs were co-expressed with (E) a replication-defective (FluPol(R-), PA K664M)36 or (F) a transcription-defective (FluPol(T-), PA D108A)8 FluPol. Luminescence signals are represented as the fold-change (FC) relative to the background, which is defined as the sum of signals measured when the FluPol(CTD-) and FluPol(R-/T-) were transfected alone (mean ± SD, n = 4, *p < 0.033, **p < 0.002, ***p < 0.001, two-way ANOVA; Sidak’s multiple comparisons test). Source data are provided as a Source data file.

