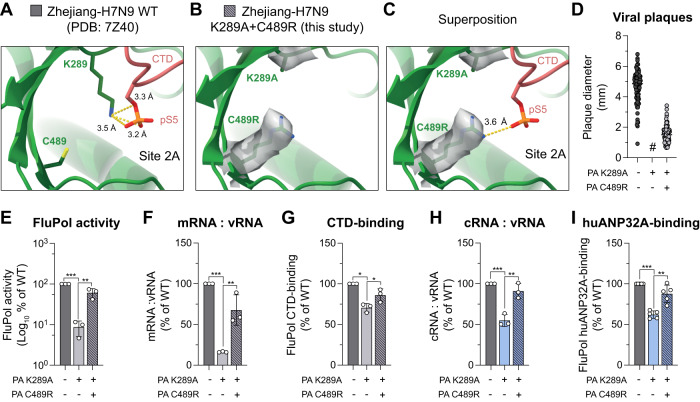
Fig. 5. Restoration of CTD-binding interface rescues FluPol replication activity and enhances FluPol binding to huANP32A.
A Cartoon representation of the pS5 CTD-bound to FluPol Zhejiang-H7N9 in site 2A (PDB: 7Z4O)22. PA subunit is coloured in green, pS5 CTD in red. PA K289-C489 residues are displayed. Putative hydrogen bonds are drawn as yellow dashed lines. Distances are indicated. B Cartoon representation of FluAPol Zhejiang-H7N9 PA K289A + C489R (obtained in this study). The Coulomb potential map of PA/K289A-C489R is shown. C Superposition of the pS5 CTD, extracted from the structure shown in (A), with the FluAPol Zhejiang-H7N9 PA K289A + C489R structure shown in (B). The putative hydrogen bond between PA C489R and pS5 is shown. Distance is indicated. D–I Phenotypes associated with the WSN FluPol PA K289A primary mutation and PA C489R second-site mutation. D Plaque phenotype of recombinant WSN mutant viruses produced by reverse genetics (n = 2), analyzed as in Fig. 2E (see Fig. S11A) (#) pinhead-sized plaques. E WSN FluPol activity was measured by vRNP reconstitution in HEK-293T cells, using a model Fluc-vRNA. Luminescence signals are represented as a percentage of PA WT. F WSN vRNPs were reconstituted in HEK-293T cells using the NA vRNA segment. The steady-state levels of NA mRNA and vRNA were quantified by strand-specific RT-qPCR35, normalised to GAPDH by the 2−ΔΔCT method71 and are presented as ratios of mRNA to vRNA levels relative to PA WT (RNA levels are shown in Fig. S11B). G WSN FluPol binding to the CTD was assessed using a split-luciferase-based complementation assay. Luminescence signals are represented as a percentage of PA WT. H Accumulation levels of cRNA and vRNA in a vRNP reconstitution assay were determined by strand-specific RT-qPCR35 as in (F). Ratios of cRNA to vRNA levels relative to PA WT are shown (RNA levels are shown in Fig. S11B). I huANP32A-binding to WSN FluPol was determined as in (G). (mean ± SD, n = 3, 3, 3, 3, 5, *p < 0.033, **p < 0.002, ***p < 0.001, one-way ANOVA; Dunnett’s multiple comparisons test). Source data are provided as a Source data file.

