
Figure 2.
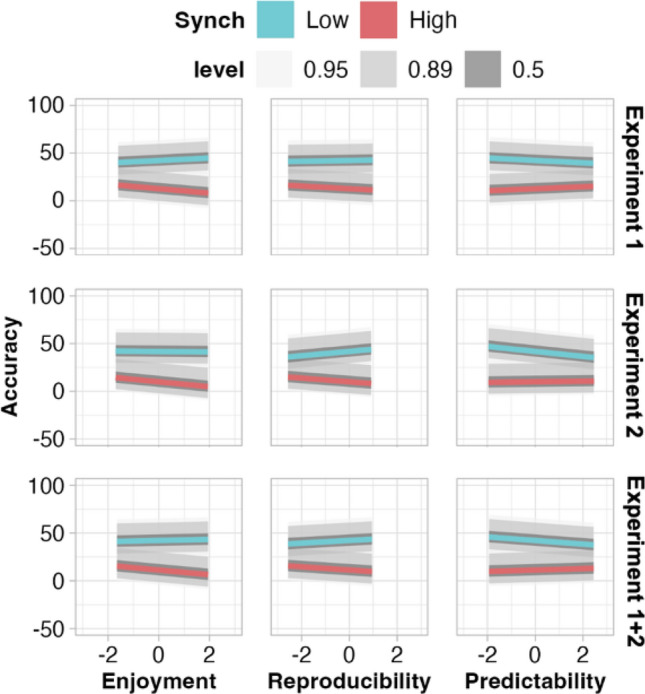
Relationship between accuracy and each enjoyment, reproducibility, and predictability of movements, per degree of synchrony and experiment. For predictability, greater positive values represent less predictability, as we calculated entropy levels, wherein smaller values represent a ‘purer’, more predictable, signal. Level shading shows interval covering the stated percentage of the posterior distribution per parameter. Parameter estimates shown in numeric form in Supplementary Table 3.