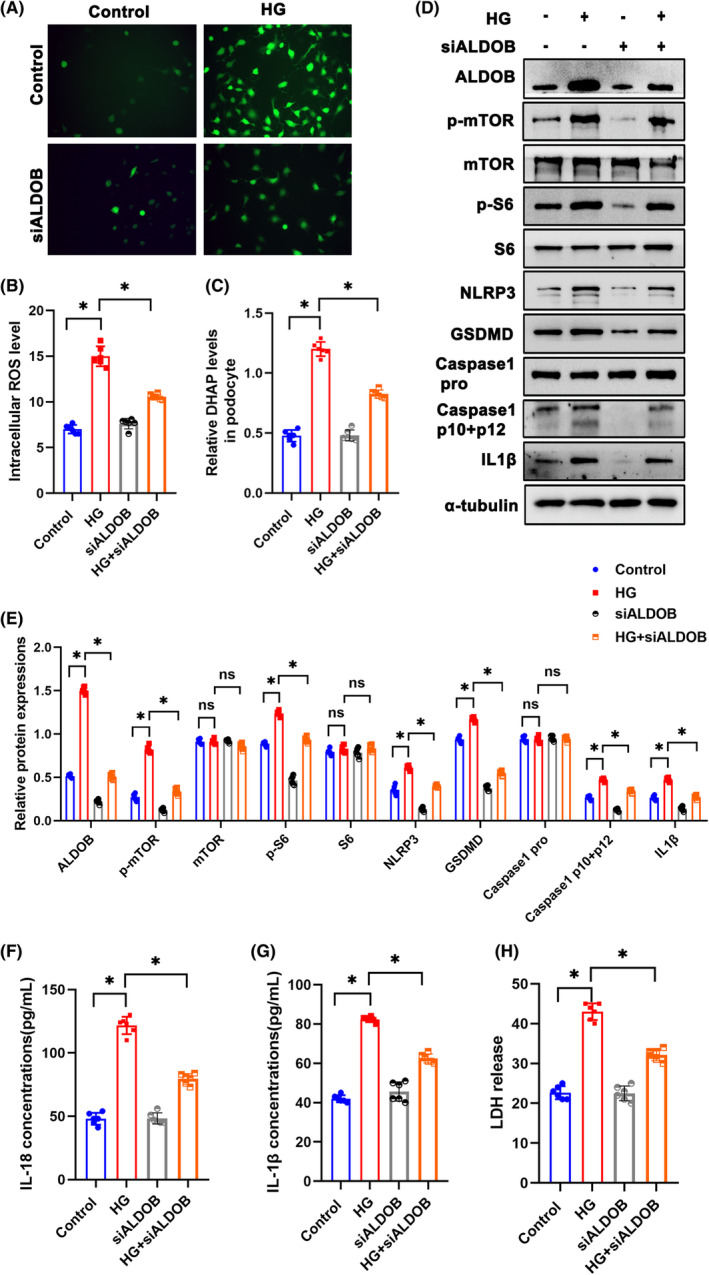
FIGURE 4.

Suppression of ALDOB alleviated pyroptosis in HG‐treated podocytes. (A, B) Representative DCFDA staining image of podocytes from each group (original magnification, ×40). (C) DHAP levels in each group. (D, E) Western blotting analysis of the expression of p‐mTOR, mTOR, p‐S6, S6, ALDOB, NLRP3, GSDMD, Caspase 1 pro, Caspase 1 p10 + p12 and IL1β in podocytes of each group. α‐tubulin was set as loading control. (F) IL‐18 levels in each group. (G) IL‐1β levels in each group. (H) LDH levels in each group. Scale bars: 10 μm. n = 6. *p < 0.05. ALDOB, aldolase B type; GSDMD, gasdermin D; HG, high glucose; IL1β, interleukin 1 beta; LDH, Lactate dehydrogenase; mTOR, mechanistic target of rapamycin kinase; NLRP3, NLR family, pyrin domain containing 3; ns, not significant; p‐mTOR, phosphor mechanistic target of rapamycin kinase; p‐S6, S6 kinase; ROS, reactive oxygen species; S6, phosphor S6 kinase.
