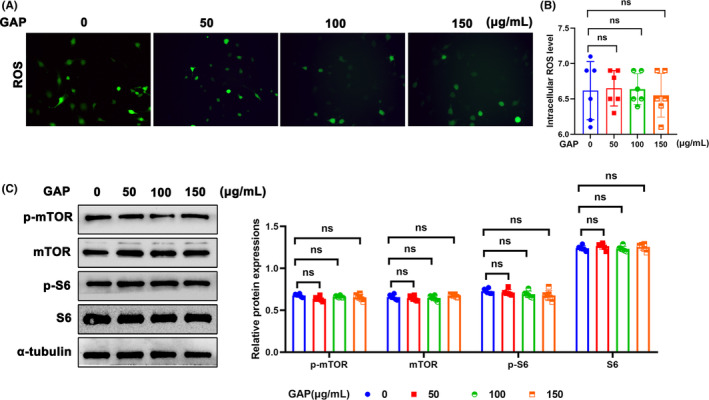
FIGURE 6.

Effect of GAP on mTORC1 pathway activity in podocytes. (A, B) Representative DCFDA staining image of podocytes from each group (original magnification, ×40). (C) Western blotting analysis of the expression of ALDOB, p‐mTOR, mTOR, p‐S6, and S6 in podocytes of each group. α‐tubulin was set as loading control. n = 6. *p < 0.05. GAP, Glyceraldehyde 3 phosphate; mTOR, mechanistic target of rapamycin kinase; ns, not significant; p‐mTOR, phosphor mechanistic target of rapamycin kinase; p‐S6, S6 kinase; ROS, reactive oxygen species; S6, phosphor S6 kinase.
