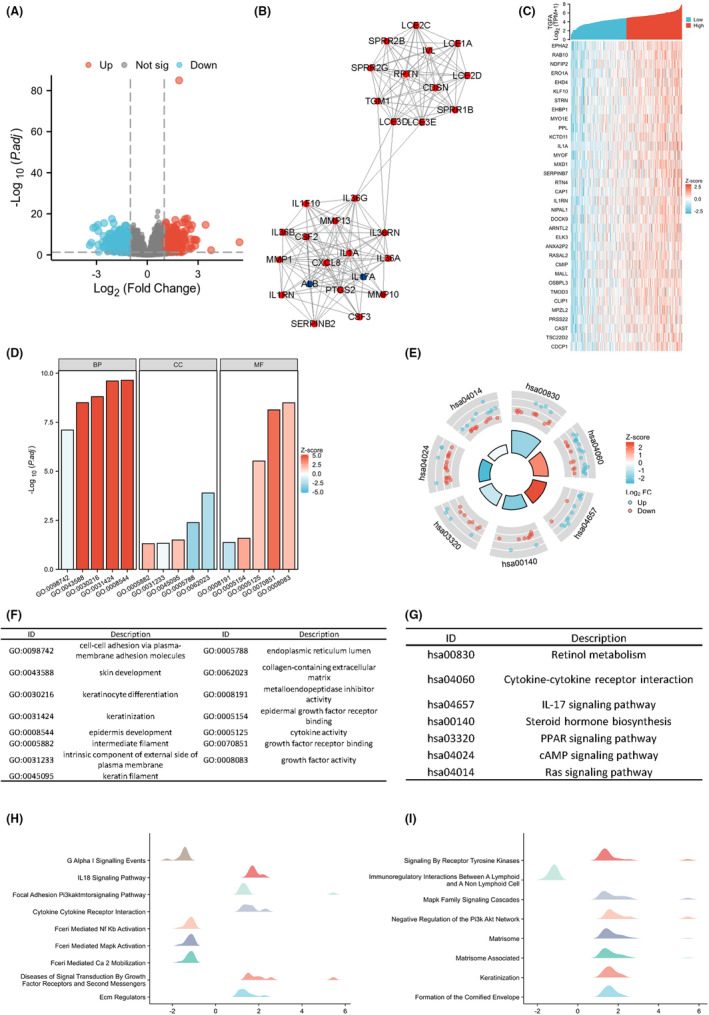
FIGURE 3.

Analysis of transforming growth factor α (TGFA)‐related differentially expressed genes. (A) Volcano map by TGFA single gene difference analysis. (B) Protein interaction network diagram of HUB gene. (C) Heat maps of co‐expression of the top 35 genes most associated with TGFA in single gene correlation analysis. (D) Gene Ontology (GO) analysis results. (E) Kyoto Encyclopedia of Genes and Genomes (KEGG) analysis results. (F, G) GO and KEGG analysis class names correspond to GO and KEGG identifiers. (H, I) Gene set enrichment analysis (GSEA) results. When the horizontal coordinate is positive, TGFA expression is positively correlated with this pathway, and when the horizontal coordinate is negative, transforming growth factor α (TGFA) expression is opposite to this pathway.
