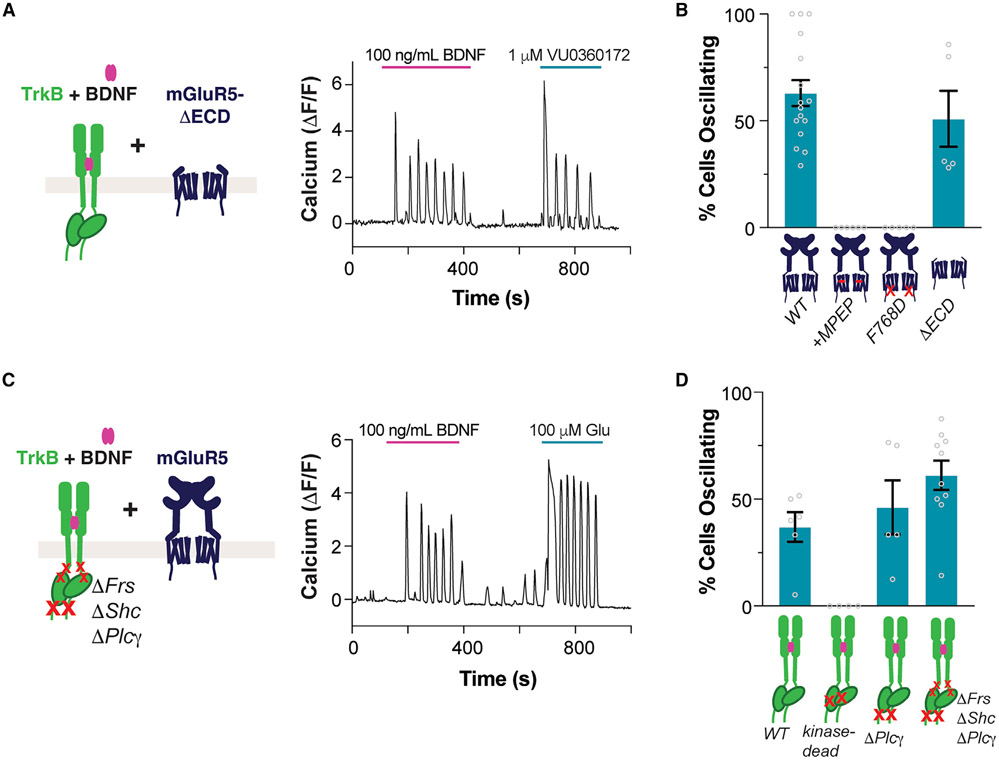
Figure 4. Molecular determinants of BDNF-induced Ca2+ oscillations.
(A) Representative trace showing BDNF-induced Ca2+ oscillations in cells co-expressing TrkB and mGluR5-ΔECD. Ca2+ oscillations are also produced with VU0360172, an mGluR5 allosteric agonist.
(B) Summary bar graph showing lack of BDNF-induced Ca2+ oscillations when mGluR5 is blocked by MPEP or when the F768D mutation is introduced, but not when the ECD is removed. Only cells responding to glutamate or VU0360172 (for mGluR5-ΔECD) were analyzed.
(C) Representative trace showing BDNF-induced Ca2+ oscillations in cells co-expressing mGluR5 and TrkB-ΔFrs-ΔShc-ΔPLCγ.
(D) Summary bar graph showing lack of BDNF-induced Ca2+ oscillations with kinase-dead TrkB (K571N), but clear oscillations for TrkB-ΔPLCγ and TrkB-ΔFrs-ΔShc-ΔPLCγ. Only cells showing a response to glutamate were analyzed. Points in (B) and (D) represent values from individual movies taken from distinct coverslips. For all conditions, data come from at least three separate cell preparations. All data are shown as the mean ± SEM. See also Figure S5.

