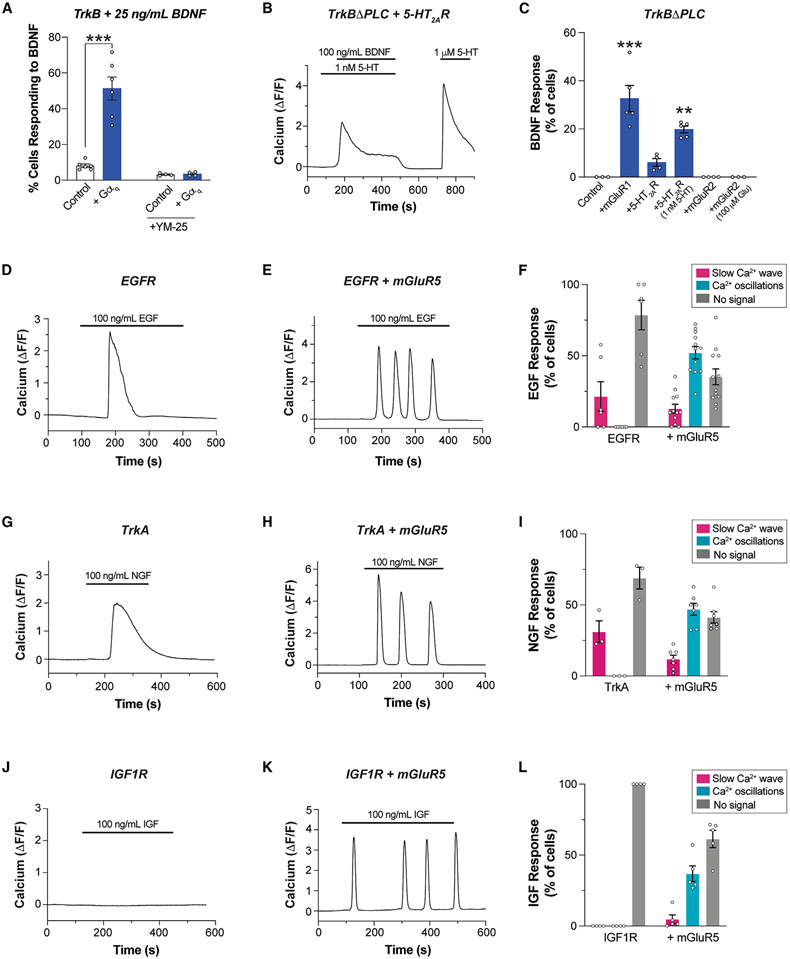
Figure 7. RTK/GPCR crosstalk is observed across a panel of receptors.
(A) Summary bar graph showing that co-expression of Gαq enhances Ca2+ responses upon low-dose BDNF-induced TrkB activation in HEK 293-TrkB cells.
(B) Representative trace showing Ca2+ response upon co-application of BDNF and subthreshold dose of 5-HT in HEK 293 cells co-expressing TrkB-ΔPLC and 5-HT2AR.
(C) Summary bar graph showing percentage of cells responding to BDNF in HEK293 cells co-expressing TrkBΔPLC and mGluR1 or 5-HT2AR or mGluR2 with or without co-application of 5-HT or glutamate.
(D and E) Representative traces showing intracellular Ca2+ responses to endogenous EGFR activation by EGF in the absence (D) or presence (E) of mGluR5.
(F) Distribution of EGF responses in the absence or presence of mGluR5 co-expression.
(G and H) Representative traces showing intracellular Ca2+ responses to TrkA activation by NGF in the absence (G) or presence (H) of mGluR5.
(I) Distribution of NGF responses in the absence or presence of mGluR5 co-expression.
(J and K) Representative traces showing intracellular Ca2+ responses to IGF1R activation by IGF in the absence (J) or presence (K) of mGluR5.
(L) Distribution of IGF responses in the absence or presence of mGluR5 co-expression. For (A) (C), (F), (I), and (L), points represent values from individual movies taken from distinct coverslips. For all conditions, data come from at least three separate cell preparations. Only cells showing a response to glutamate are analyzed in the conditions with mGluR5. One-way ANOVA with Tukey’s multiple comparisons is used for (A) and (C). All data are shown as the mean ± SEM; **p < 0.01, ***p < 0.001. See also Figure S8.

