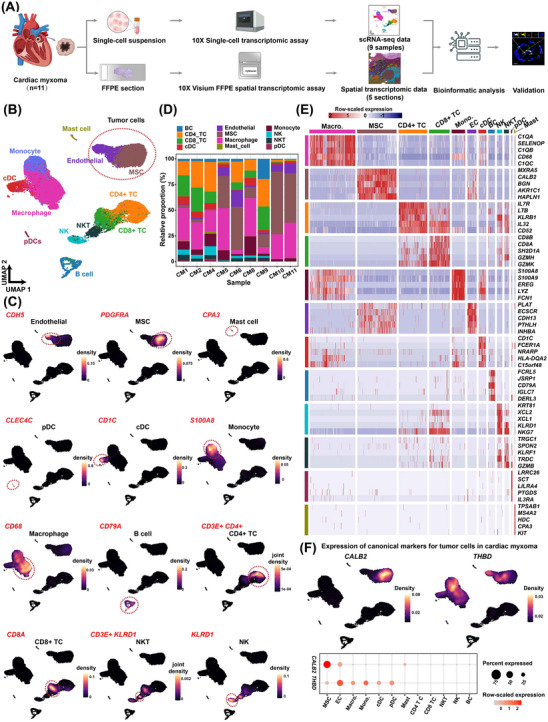
FIGURE 1.

Single‐cell transcriptomic landscape of CM. (A) Schematic representation of the experimental procedure. CM tissues from patients (n = 11) were collected during surgical resection. Fresh samples from nine patients were individually subjected to scRNA‐seq, and FFPE tissue sections from five patients were subjected to ST assays. Three patients had both single‐cell and ST data available and two patients had only ST data. (B) UMAP visualisation of cellular identity. (C) Expression distribution of the marker gene(s) for each cell type. The visualisation was enhanced by gene‐weighted density estimation using the R package Nebulosa to recover the signal from dropped‐out features. (D) Relative proportion of each cell type in each sample. (E) Heatmap showing the expression of representative signature genes for each cell type. (F) UMAP (upper panel) and dot plots (lower panel) showing the expression of the canonical markers CALB2 and THBD for myxoma tumour cells in each cellular cluster. BC, B cell; cDC, conventional plasmacytoid dendritic cell; EC, endothelial cell; MSC, mesenchymal stroma cell; Macro, macrophage; Mono, monocyte; NK, natural killer cell; NKT, natural killer T cell; pDC, plasmacytoid dendritic cell; TC, T cell; CM, cardiac myxoma; ST, spatial transcriptomic; scRNA, single‐cell RNA; UMAP, Uniform Manifold Approximation and Projection.
