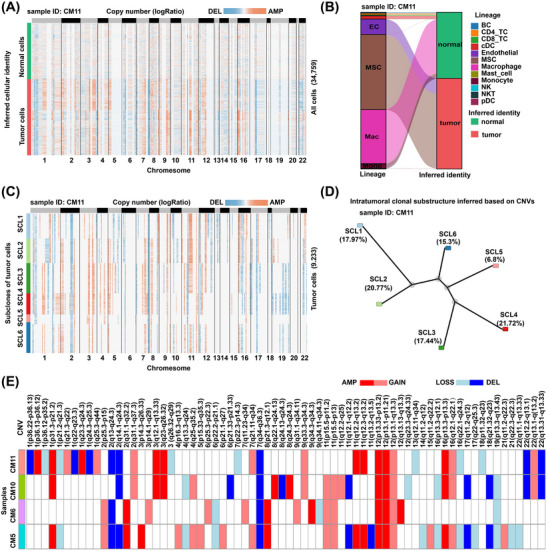
FIGURE 2.

Tumour/normal cell classification and clonal substructure inference in CM based on copy number profiles inferred by the scRNA‐seq data. (A) Classification of myxoma cells as tumour cells and normal cells based on the copy number profile in sample CM11. (B) Alluvial plot showing that the myxoma cells with EC or MSC identities were classified as tumour cells in sample CM11. (C) Copy number profile of each subclone in tumour cells of sample CM11. (D) Phylogenetic tree showing the intratumoural clonal substructure of sample CM11. (E) OncoPrint‐like plot highlighting intertumoural heterogeneity in CM. The above analyses were performed using the method implemented in the R package SCEVAN. Only four samples were considered because they had a relatively high proportion of tumour cells. In A–D, the results are shown for a representative sample CM11. AMP, amplification; CNV, copy number variation; CM, cardiac myxoma; DEL: deletion; scRNA‐seq, single‐cell RNA‐seq.
